Asset Allocation Weekly (June 29, 2018)
by Asset Allocation Committee
With the recent narrowing of the yield curve, we have been receiving a number of questions about the impact of inversion. Defined, yield curve inversion is when short-duration interest rates rise above long-duration interest rates. The yield curve is arguably the single best indicator of recession. Therefore, with various calculations of the yield curve narrowing, we want to examine the impact of inversion.
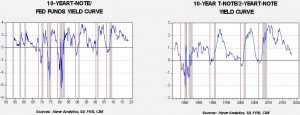
The first problem one confronts during this analysis is defining which rate spread constitutes the most appropriate yield curve to monitor. The Conference Board, in its calculation of leading economic indicators, uses the 10-year T-note yield less fed funds. This spread compares a market yield (the 10-year T-note) with a policy rate (fed funds); given that the latter is mostly in control of the Federal Reserve, this measure of the yield curve is the clearest indication of policy intentions. In other words, when the FOMC allows the policy rate to exceed long-duration yields, it clearly believes that the threat of inflation outweighs the potential costs of recession. The problem with this yield curve is that one part of it is directly under the control of policymakers and thus can be manipulated. The other popular measure is the 10-year T-note less the two-year T-note. Because the rates are mostly set by the market, this spread represents the market’s estimate of the potential of recession.
The above graphs show both of the aforementioned yield curves. Recessions are shown by gray bars; the red vertical lines indicate the month of yield curve inversion prior to a recession. We have a longer history for fed funds compared to the two-year T-note, but the results are similar. The fed funds version inverts, on average, 14 months before the onset of recession. The shortest lead was nine months, while the longest was 20 months. For the two-year T-note version, the average from inversion to recession was 15 months, with the shortest lead at 10 months and the longest at 18 months. The fed funds version did produce two false positives, in 1966 and 1998, while the two-year T-note version had one, in 2006. But, as business cycle indicators go, either version of the yield curve is very reliable and gives sufficient warning.
So, if the yield curve inverts, what should investors do?
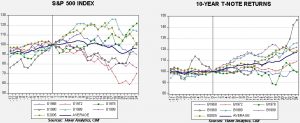
These two charts show equities (the S&P 500) and long-duration bonds (10-year T-notes total return index), indexed to the yield curve inversion (shown as a vertical line on the chart). We looked at the data 12 months before the inversion and 24 months after the inversion. We also calculated the average for the seven events. The data show that these financial markets don’t always treat inversions as bearish. Under low inflation conditions, long-duration interest rates tend to perform well. Equities decline about 10% or less after inversion the majority of the time; however, in three cases, they actually continued to rise. Furthermore, during the 2005 inversion the real bear market didn’t start until two years after the yield curve turned negative.
We are paying very close attention to the yield curve but it should be noted that it may take a few months before equity markets peak even after inversion takes place. Thus, investors should not necessarily exit equities but should be prepared to reduce exposure. On the other hand, inversion is a reasonably reliable signal that extending duration in fixed income should be considered.


