Asset Allocation Weekly (June 18, 2021)
by the Asset Allocation Committee | PDF
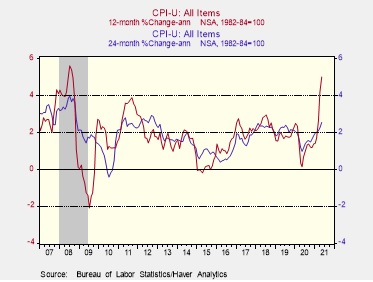
As the global economy begins to recover from the coronavirus, we’ve been warning that the apparent surge in price inflation may not be all that it seems. Inflation is usually calculated as the percentage change over one year. Since many consumer prices stagnated or fell at the start of the pandemic a year ago and only recently started to recover, “base effects” alone make it look like inflation is extraordinarily high. In fact, the May consumer price index (CPI) was up 5.0% from one year earlier, marking its biggest annual gain since mid-2008. To look through the unusual pandemic distortions and see where the trends really are, we’ve begun to focus more on the two-year rate of change. As shown in the chart below, a comparison of the CPI in May 2021 versus the CPI in May 2019 would imply an average annual rise of just 2.5% over the last two years. That’s still elevated compared with the recent past, but it’s only half as big as the inflation rate calculated over one year.
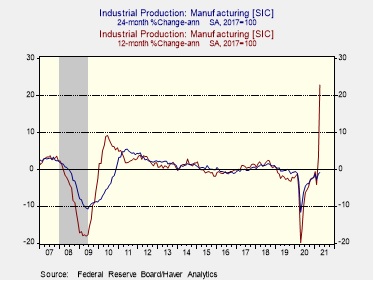
We’ve been arguing that these base effects will drop out of the calculation and result in more moderate inflation readings later this year, but the same can be said for many other economic indicators, even if they aren’t typically calculated on a year-over-year basis. For example, the Federal Reserve’s index of manufacturing production for April (latest available data) was up an astounding 22.8% from April 2020. However, that largely reflects base effects related to last spring’s sharp drop in output followed by a more recent recovery in production. If we compare output in April 2021 to the output in April 2019, the average annual increase over the last two years comes to -0.9%. In other words, factory production these days is actually a bit less than it was before the pandemic.
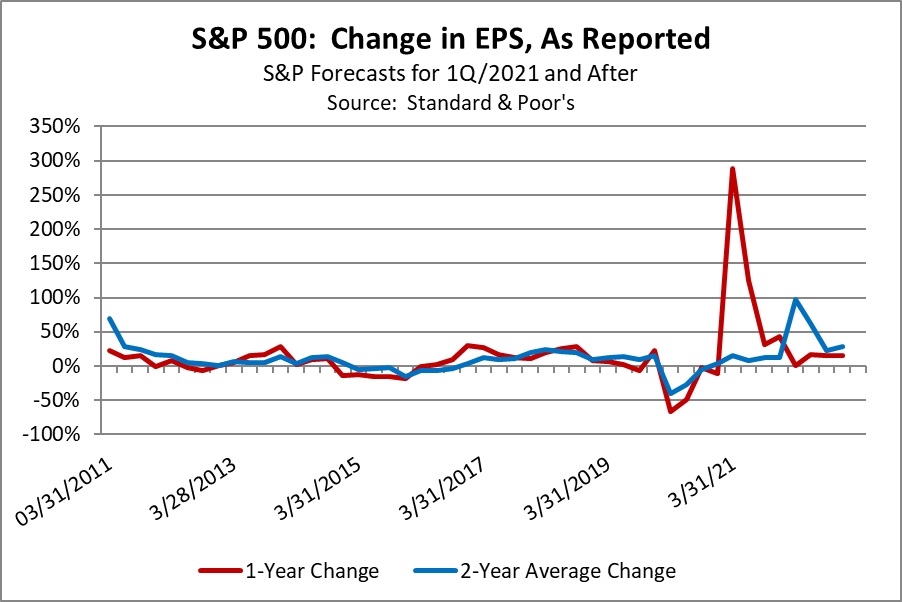
The concept of base effects may be especially important for stock investors as they look at corporate earnings. In the first quarter of 2021, earnings per share (EPS) on the S&P 500 index will be up approximately 288.1% year-over-year, but that’s only because of the sharp drop in profits at the outset of the pandemic followed by a recovery in recent quarters. As shown in the chart below, the expected EPS of $46.10 would only represent an average annual gain of about 14.7% over the last two years. That’s better than the average annual EPS growth of about 8.4% over the last couple of decades, but it’s still weaker than the average gain of 16.2% over the most recent five years. In sum, investors should be mindful of the big distortions that the pandemic has caused in all kinds of economic and financial data. Looking at the two-year average changes may help investors gauge the true state of affairs more accurately. While we still think equities can perform well in the near term, the gains may be much less dramatic than might be implied by just the year-over-year earnings growth.