

Asset Allocation Weekly (June 14, 2019)
by Asset Allocation Committee
Establishing when “the” yield curve inverts is a bit of guesswork as there are a plethora of permutations one can use to calculate the spread. One yield curve we like is the same one the Conference Board uses in its index of Leading Economic Indicators, namely, the 10-year T-note less fed funds yield. As we show below, this particular spread has inverted this month. Because of the time it takes to fully accumulate all the data points in the leading indicators, the inverted yield curve won’t be in the index until August. But, the inversion will start to act as a drag on the leading indicators and likely start signaling a slowdown in the economy.
Here is a chart of the 10-year/fed funds yield curve.
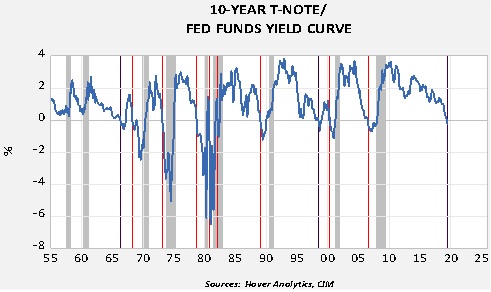
This spread didn’t become a reliable indicator of the economy until the 1960s. It isn’t perfect; it has had two false positives (shown as a black lines on the above chart). In the 1981-82 recession, the curve didn’t invert until the recession was underway. We have shown the current inversion as a black line, but we will change this if, or when, the recession develops.
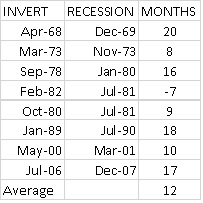
This table shows the time period from the inversion to recession. Although there is variation, the average is 12 months. Using the range, a recession would be due at the earliest in February 2020 or the latest at February 2021.
So, with inversion, what should investors do?
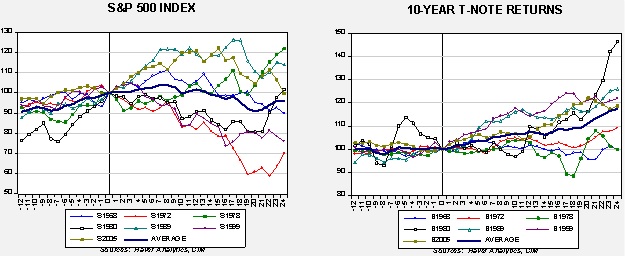
These two charts show equities (the S&P 500) and long-duration bonds (10-year T-notes total return index), indexed to the yield curve inversion (shown as a vertical line on the chart). We looked at the data 12 months before the inversion and 24 months after the inversion, excluding the 1982 inversion since the recession was already underway. We also calculated the average for the seven events. These calculations show that the financial markets don’t always treat inversions as bearish. Under low inflation conditions, long-duration interest rates tend to perform well. Equities decline about 10% or less after inversion the majority of the time; however, in three cases, they actually continued to rise. Furthermore, during the 2005 inversion, the real bear market didn’t start until two years after the yield curve turned negative.
There are two key issues for investors. First, it is possible that the current inversion is a false positive. If the FOMC moves quickly to cut the fed funds rate, the slope of the curve could return to positive so remaining fully invested is recommended. Second, even if this inversion is a harbinger of recession, there were several events where equities performed quite well for some time after the inversion. This is especially true when the inversion predated the recession by more than a year. At the same time, investors are now on notice that if the Fed doesn’t react soon to unwind this inversion then the odds of recession are rising, thus it would be prudent to build a plan to become defensive.