

Asset Allocation Weekly (January 4, 2019)
by Asset Allocation Committee
Quantitative easing (QE) was an element of unconventional monetary policy that emerged from the Great Financial Crisis. When the Federal Reserve lowered the fed funds target to zero (known as the “zero interest rate policy,” or ZIRP), policymakers decided that taking the policy rate below zero would not further stimulate the economy. Once interest rates fall below zero, idle cash generates a return and there was fear that negative interest rates would cause cash hoarding, which was exactly what the Fed wanted to avoid. However, policymakers also feared that signaling they lacked additional tools to support the economy could trigger a panic in financial markets. Thus, they created an additional tool, QE, which bought Treasuries and mortgages from the financial system and pushed additional cash into the economy.
The policy was controversial. Some feared it would trigger inflation as the high levels of cash would “inevitably” cause rising prices. Others argued that the process would distort financial markets. But, in the end, the effects of QE were difficult to parse. For example, one of the Fed’s arguments for QE was that it would lower long-term interest rates. In fact, at times, it seemed to have precisely the opposite effect.
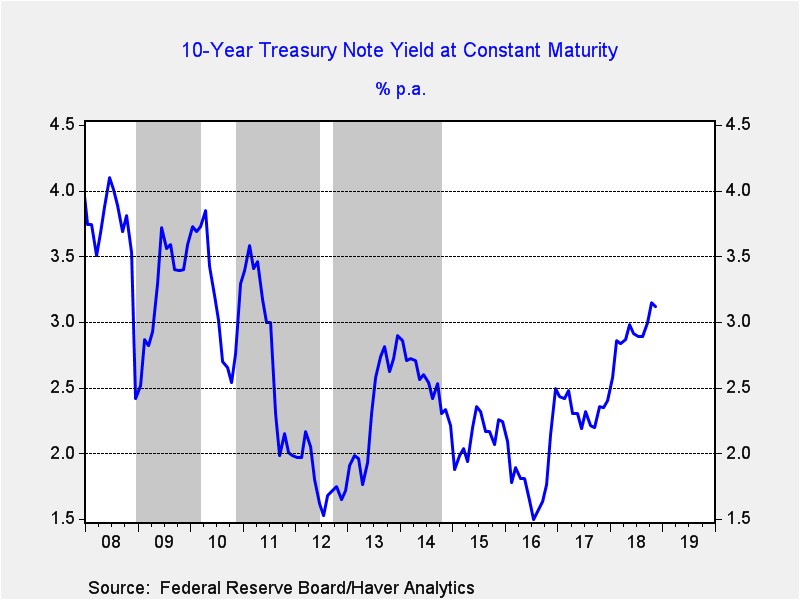
This chart shows the 10-year T-note yield. The gray bars show periods of QE. In all three events, yields rose at the onset of the balance sheet expansion. Yields eventually fell during QE2, although that decline was probably more due to turmoil in Europe. Why did yields rise when the Fed was reducing the supply of bonds? Most likely, investors worried that QE would be successful in bringing about inflation and thus demand was adversely affected. Anticipation of the end of QE always led to a drop in yields.
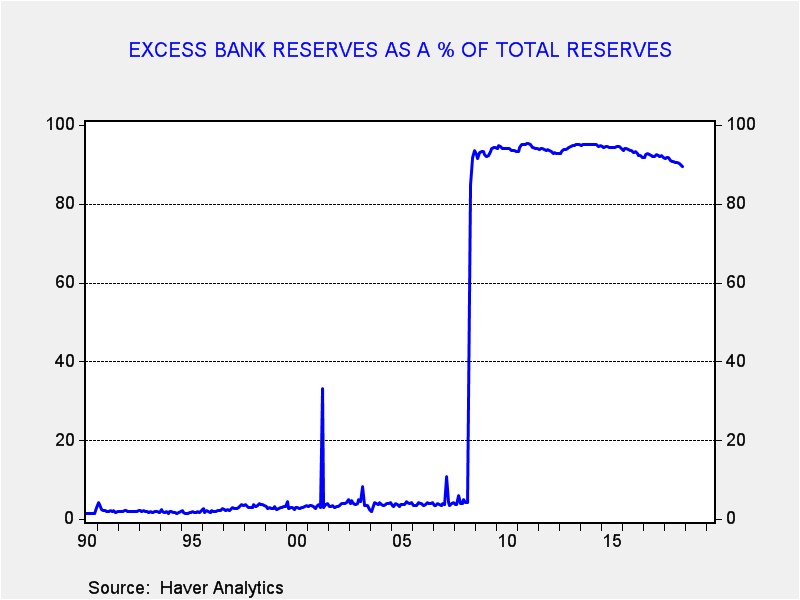
What about all that money that was injected into the system? Much of it remained on bank balance sheets in the form of excess reserves.
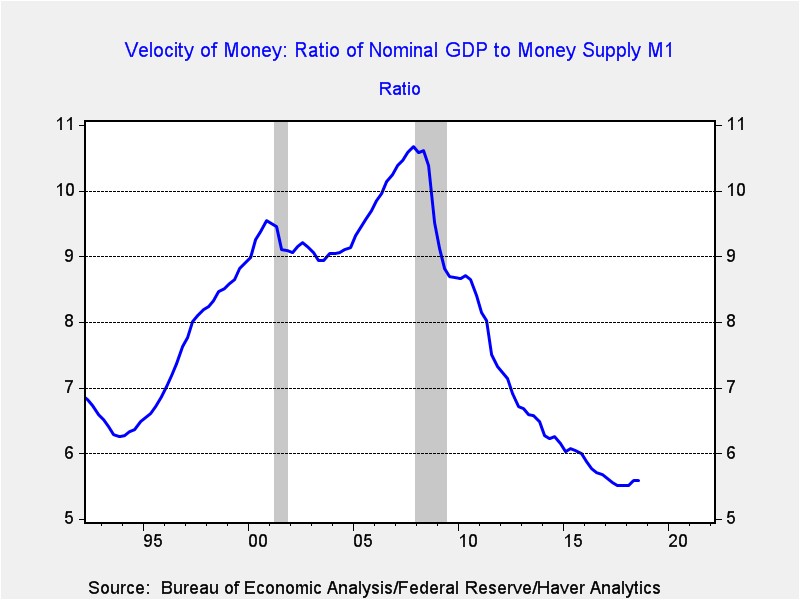
Using the equation of exchange (money supply x velocity = price x quantity), the increase in the money supply mostly led to a sharp drop in velocity, instead of boosting prices or quantity.
So, if QE mostly sat idle on bank balance sheets then the withdrawal of QE should not have had much of a real impact on the economy. And, that is likely true. However, this isn’t to say that QE had no effect. As we have noted in the past, there has been a close correlation between the S&P and the Fed’s balance sheet.
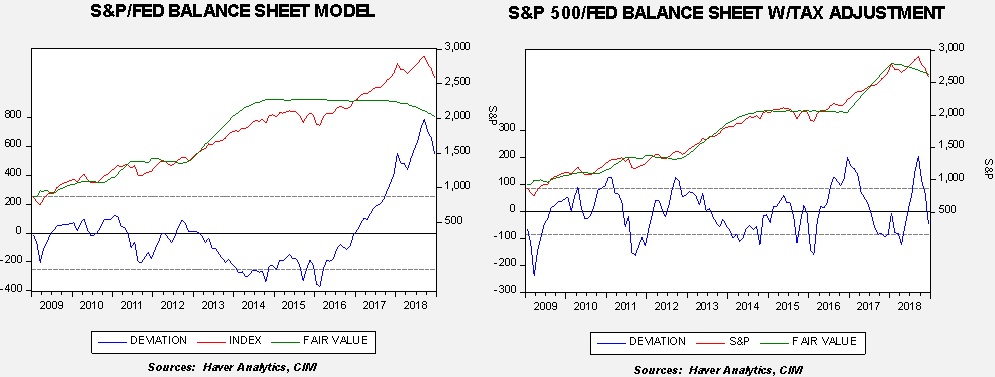
The chart on the left shows the original balance sheet model; note that after Trump’s election in 2016 the S&P rose much more than the model would have projected. To account for this move, we built a variable that adjusted for expectations surrounding corporate tax cuts. The additional variable improved the model dramatically; however, assuming no further reductions in corporate tax rates, the market is once again tracking the balance sheet.
Essentially, it appears that the impact of QE was mostly psychological; it signaled to investors that the Fed was supportive. Interestingly enough, the withdrawal appears to be adversely affecting investor sentiment. It is hard to determine how much, simply because there are other factors, such as trade conflicts and FOMC criticism, which are also affecting sentiment. However, this data suggests that a pause in the balance sheet reduction would likely improve investor sentiment.