Asset Allocation Weekly (January 17, 2020)
by Asset Allocation Committee
The December employment data showed three interesting developments that are worth discussing. They are wage growth, hours worked and the level of “out of the workforce.”
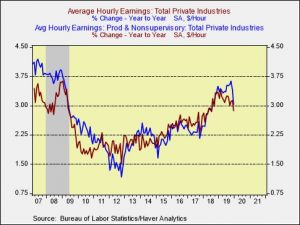
Wage growth: For most of last year, production and non-supervisory wage growth was outpacing that of overall workers. This development suggested that ordinary workers were finally benefiting from the long expansion. However, it was uncertain if the growth was due more to changes in state and local minimum wage laws or due to tight labor markets. It appears we have our answer. Many of the changes to local and state minimum wage laws occurred after the 2018 midterm elections. December’s data would be 13 months after many of these new laws came into effect, so if legislation was the primary cause of the rise in ordinary worker pay then we should have seen a drop in December’s wage growth.
In fact, that’s exactly what we saw. In November, wage growth for this class of worker rose 3.4%; it fell 40 bps to 3.0% in December. Thus, the divergence between total private wages and production and non-supervisory worker wages appears to be solely a function of minimum wage laws. Without additional measures, it seems unlikely that the divergence will continue.
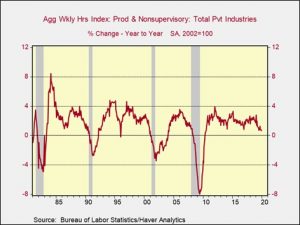
Hours worked: The growth rate of hours worked by production and non-supervisory workers fell to its lowest level since June 2010.
The combination of fewer hours and falling wage growth will tend to further dampen available liquidity for the majority of households. The weekly hours data isn’t recessionary, but it is headed in that direction.
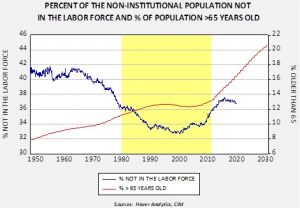
Out of the workforce: When the Bureau of Labor Statistics calculates the labor force, it includes those working and looking for work. Some citizens purposely decide to stay out of the labor force for a myriad of reasons, with age being the most likely. In other words, as the number of citizens reaching retirement age increases, the percentage of the population that can continue to work will tend to decline as will the potential labor force. Nevertheless, as the expansion continues, the potential pool of those out of the labor force tends to decrease until a point is reached where it becomes nearly impossible to draw down this group any further. At that point, wage growth is expected to rise; at the same time, the unemployment rate can’t decline any further because potential new workers become increasingly difficult to find.
The economy may be nearing that point.
The blue line shows the percentage of those not in the labor force relative to the non-institutional population over the age of 16. The red line is the percentage of the total U.S. population older than 65, with Census Bureau forecasts. The area in yellow represents the baby boom generation. The start of this area is when the last baby boomer turned 16, and the end is when the first baby boomer hit the age of 65. In the yellow area, the percentage not in the labor force fell and stabilized. As baby boomers headed into retirement age the percentage not in the labor force began to climb. However, this percentage has recently stalled, mostly due to the extended economic expansion. This trend will be difficult to sustain as the 65+ population continues to rise. Although we are seeing workers delay retirement, the recent trend should reverse over time. That factor will tend to keep the unemployment rate lower than it has been historically.
What is important about these three trends is that two of them are suggesting some softening in the labor market, whereas the last one might mask that weakness by showing a low unemployment rate. In other words, older workers, facing a weaker labor market, may simply opt for retirement and leave the labor force entirely. That will reduce the labor force and keep the unemployment rate low, suggesting the labor market is tighter than it really is. That factor could increase the potential for a policy error.


