Asset Allocation Weekly (January 11, 2019)
by Asset Allocation Committee
Does the Federal Reserve adjust policy for asset prices? This is perhaps one of the most controversial topics in U.S. monetary policy. Alan Greenspan faced this issue in the early 1990s. Both Volcker and Greenspan wanted to focus monetary policy on containing inflation. But, Larry Lindsey, a Fed governor at the time, noted that if outside forces, such as technology and trade, were keeping inflation down then the Fed could engage in easy monetary policy without the risk of rising price levels. He warned this could cause asset bubbles.[1] Greenspan, an adept corporate infighter, prevented Lindsey’s position from gathering any momentum. But, as the “irrational exuberance” speech showed on December 20, 1996, he became concerned about overheating financial markets.[2] However, the reaction to the speech led the powerful Greenspan to realize there wasn’t much upside in conducting monetary policy to quell asset bubbles. Instead, policy evolved to address the aftermath of bubbles.
Still, the idea of low interest rates triggering asset inflation never really went away. The Great Financial Crisis proved that the costs of cleaning up after a bubble could be considerable. It was one thing to have a bubble in technology stocks; in general, technology becomes obsolete so quickly that excess capacity in that sector doesn’t have a lasting effect. On the other hand, a bubble in housing can depress economic activity for years. Jeremy Stein, a Fed governor from 2012 to 2014, raised concerns about financial excesses.[3]
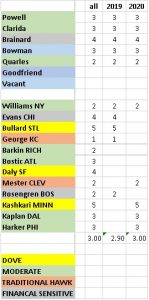
In the current configuration of the FOMC, shown below, we rate them according to their policy bias (on a 1 to 5 scale, with 1 being the most hawkish and 5 most dovish) and by theoretical inclination. The latter reflects traditional hawks, characterized by a restrictive view of the Phillips Curve, traditional doves, who have an expansive view of the Phillips Curve, moderates, who make policy based on a variety of factors but tend to be “data-dependent” (in practice, atheoritical and not tied to the Phillips Curve) and financial asset-sensitive. The table below shows the breakdown. The number shows policy bias based on our analysis of comments and voting patterns. The colors show what we view as their theoretical background. Among the voters this year, the average is nearly 3, suggesting a moderate voting bloc. This year, there is only one dove and one hawk, five moderates and three financial market-sensitive voters. The doves tend to raise rates reluctantly; hawks tend to cut rates with the same distaste. Moderates are mostly a diverse group from a theoretical perspective. For our purposes, the important difference of this group compared to the traditional hawks and doves is skepticism about the Phillips Curve. These voters tend to watch trends in the overall economy and make policy decisions. Interestingly enough, three of the governors appointed by President Trump have been moderates and he also promoted Jerome Powell to chair of the FOMC. For a president who seems to prefer doves, he has been steered into appointing moderates. Finally, there are three members who, in the comments, seem much attuned to the behavior of financial markets. Governor Brainard has voted as a dove but has expressed concern about market overheating and has used that position to support recent rate hikes.
This year, we have three voters we dub as “financial-sensitive.” Thus, financial market behavior may be important to the path of policy this year.
However, as Greenspan noted, it’s hard in real time to determine whether an asset market is in a bubble. And, it can be equally difficult to determine whether the cost of raising rates to prevent the bubble is less expensive than addressing the aftermath. The key problem with asset bubbles is that they leads to malinvestment. In a long-lasting asset, that can mean years of technical inefficiency because capacity can’t be fully utilized. Thus, a housing bubble can lead to too much real estate that can take years to absorb; cutting interest rates can help slow the inevitable decline in prices but may actually expend the period necessary to balance the market. On the other hand, a bubble in wheat lasts one growing season and policymakers shouldn’t bother to address the problem.
In addition, it would be politically explosive for policymakers to raise rates solely because equity or home prices have risen “excessively.” The backlash would threaten central bank independence. Thus, if the Fed is worried about an asset bubble, it would need some measure other than valuation to raise rates.
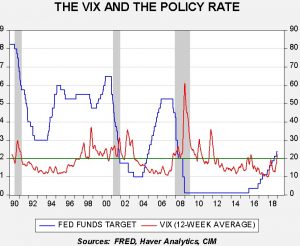
One possibility we have examined recently is volatility. Does the FOMC adjust rates based on the equity market VIX? There appears to be some evidence that policymakers may be sensitive to market volatility.
This chart shows the weekly fed funds target with the 12-week average of the CBOE VIX index. We have placed a bold line at 20 for the VIX. Since the late 1990s, we note that the FOMC was inclined to keep lowering rates with a VIX above 20; a reading under 20 would tend to support policy tightening. So, in 2002, Chair Greenspan kept cutting rates even though the economy was in clear recovery. It may have been due to perceptions that investor sentiment was overly negative. The 2004-06 tightening cycle occurred with a VIX persistently below 20. In fact, rate cuts seemed to occur as the VIX rose. We also note that the 2016 pause occurred after the VIX rose back above 20, and tapering was announced in 2016 after a prolonged period of a low VIX. The current pause coincides with the recent lift in volatility.
We also examined adding the VIX to the Mankiw Rule model variations. What we found is that the index is statistically significant in three of the variations and the correct sign in two. However, in the variations it did correctly affect, it didn’t necessarily improve the forecasting accuracy by more than 10 bps. This performance suggests that the VIX may have an impact on policy but the Phillips Curve variables, labor market data and inflation, are still more important. However, the hard part to divine is the impact of the VIX on the moderate voters. Even if all of the market-sensitive members pay attention to the VIX, the moderates may only pay attention at extremes.
Therefore, in conclusion, we can probably say the following—when the VIX is below 20, the Fed is probably more likely to consider tightening policy. A reading above 20 may lead to a pause or could encourage further easing. However, the relationship isn’t precise, which suggests the traditional hawks and doves don’t pay much attention to market volatility. The VIX may be the way that market-sensitive FOMC members can incorporate financial markets into their policy decisions without overtly targeting valuations or returns.
[1] Mallaby, Sebastian. (2016). The Man Who Knew: The Life and Times of Alan Greenspan. New York, NY: Penguin Books. (pp. 435-36.)
[2] Ibid, pp. 504-506.
[3] https://fraser.stlouisfed.org/title/1163/item/2372 and https://fraser.stlouisfed.org/title/1163/item/476707


