

Asset Allocation Weekly (January 10, 2020)
by Asset Allocation Committee
In our 2020 Outlook, we discussed three risks to the forecast, with one of them being a “melt-up” or a dramatic rise in stock prices. One of the key factors that could bolster higher prices for risk assets would be the idea that the FOMC has engineered a soft landing, which is best defined as a tightening cycle that doesn’t result in a recession.
In December 2015, the Fed raised the policy rate by 25 bps, lifting the rate from 0.125% to 0.375%. The conventional policy models, mostly based on the Taylor Rule, suggested that a series of rate hikes was likely.
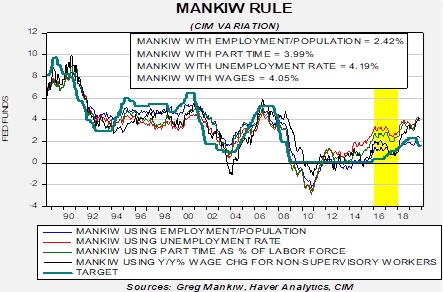
This chart shows four variations of the Mankiw Rule, which is different from the Taylor Rule in how it measures slack in the economy. The former used the unemployment rate, while the latter uses the difference between actual and potential GDP. We prefer the Mankiw Rule because labor market measures are easily observable, whereas potential GDP is not. We have created four variations of the Mankiw Rule using various measures of the labor market. In the chart above, the area highlighted in yellow shows that all the Mankiw variations were suggesting the policy rate was too low and the Fed needed to raise rates aggressively. The financial markets feared tighter monetary policy but, as the chart shows, after an initial hike the Yellen Fed paused for a year before raising rates again.
Why did this pause occur? A contributing factor appears to be fragility in the financial markets.
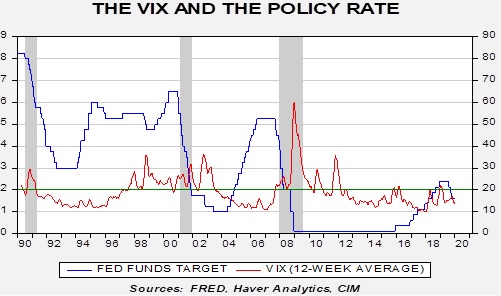
This chart shows the 12-week average of the VIX index of S&P 500 volatility and the fed funds target. Note that the VIX rose above 20 with the rate hike in December 2015. It is possible the FOMC worried about triggering broader financial problems by raising rates and thus paused to allow financial markets to “calm down” before raising rates further.
In the recent tightening cycle, the Powell Fed raised rates until the VIX broke 20; soon after, the Fed lowered rates even though the Mankiw Rules would suggest further tightening was in order. The Fed would be loath for the financial markets to conclude there is a “Fed put,” but, given how sensitive consumption has become to asset values, avoiding a recession may require guiding policy to prevent volatility from rising.
So, if this is what the Fed is doing, what does it mean for equities? We indexed the S&P 500 to early February 2016, when it became clear that Yellen would keep policy on hold, and January 2019, when Powell signaled at least a pause in tightening. The idea is that equities should benefit if the Fed avoids a “hard landing.”
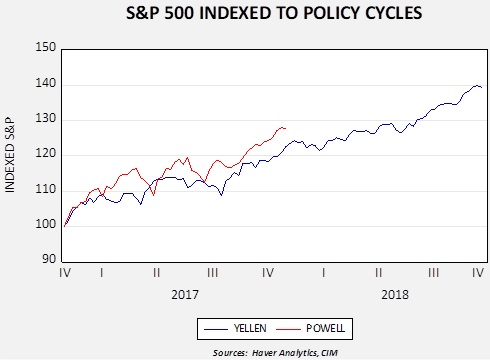
The two periods are generally tracking each other; if this pattern continues, the current S&P 500 would end up at 3532.56 by late November. This analysis is clearly not foolproof as one episode of a soft landing won’t necessarily generate a repeat performance. Nevertheless, we are tracking relatively closely so further gains in stocks are possible if a recession is avoided. The trick is avoiding recession; accommodative monetary policy is probably a necessary, but not completely sufficient, condition for avoiding a downturn.