

Asset Allocation Weekly (February 15, 2019)
by Asset Allocation Committee
The pullback in equities in Q4 coincided with a sharp drop in long-duration Treasury yields. However, the recovery seen in early 2019 has not led to a rise in yields.
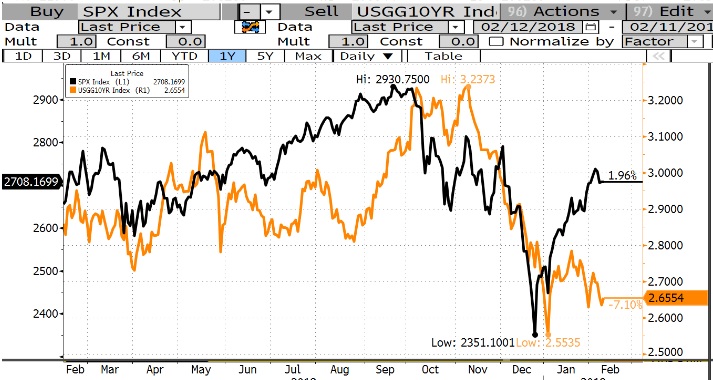
This chart shows the S&P 500 (left axis) and the 10-year T-note yield (right axis). Note that yields and the equity markets tended to rise together in the first three quarters of 2018. More importantly, they tracked each other in the fourth quarter; as equity values fell, yields also declined. However, as equities have recovered since late December, yields have not rebounded into the range where they were when the S&P was around 2700.
In part, yields are currently running below fair value.
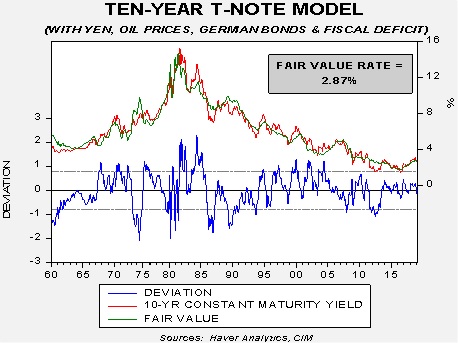
This chart shows our bond model; the core variables are fed funds and the 15-year average of CPI.[1] In addition to these variables, we add the JPY/USD exchange rate, crude oil prices, German 10-year sovereign yields and the Federal deficit/GDP ratio. The market would not be “rich” in this model until yields approach 2.17% but they are modestly below fair value after being above fair value for most of last year.
There are thee variables that account for the decline in the 10-year T-note yield, fed funds, German sovereign 10-year yields and oil prices. In October, the 10-year T-note yield was running around 3.15%. That level had discounted oil prices at $60 per barrel, German yields at 20 bps and a terminal fed funds rate of 3.25%. The decline in the fed funds estimate to 2.50% accounted for 30 bps in the decline in yield, while the remaining 3 bps to fair value came from the decline in oil prices to $55 per barrel and German 10-year sovereign yield declines to 14 bps.
The “undershoot” to 2.70, below the fair value of 2.87%, could be achieved with a fed funds of 2.12%. Given that the actual target is the mid-point between the upper and lower bound of the fed funds target (the announced rate is actually the upper bound), this would imply a rate cut. Or, a decline in inflation expectations to 1.8% from 2.1% could also account for the undershoot, assuming no change in fed funds.
We suspect the primary reason for the slide is that inflation expectations have probably fallen. This is because there isn’t much in the data to support the FOMC cutting rates.
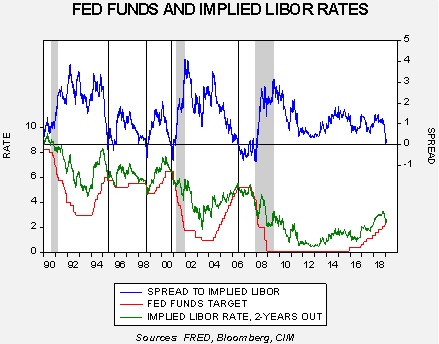
This chart compares the fed funds target to the implied three-month LIBOR rate from the two-year deferred Eurodollar futures contract. History shows that policymakers tend to stop raising rates when the spread between these two rates invert. As the spread line shows, the spread is near inversion which is consistent with a policy pause but would not be consistent with rate declines. Policy cuts would be in order if the implied yield were to fall further, but that evidence doesn’t exist for now.
If inflation expectations are leading to the undershoot, then stronger economic growth could trigger a rise in inflation fears. We would not be surprised to see a modest rise in yields in the coming weeks, but a rise beyond 3.00% on the 10-year T-note yield would likely require a return to policy tightening by the FOMC. We would not expect such a shift until later this year, if then.
[1] Which is a proxy for inflation expectations.