

Asset Allocation Weekly (December 15, 2017)
by Asset Allocation Committee
Last week, the Federal Reserve released its Financial Accounts of the United States, formerly called the Flow of Funds report. It is a broad set of data that covers many aspects of the economy. Here we present some key charts from the report.
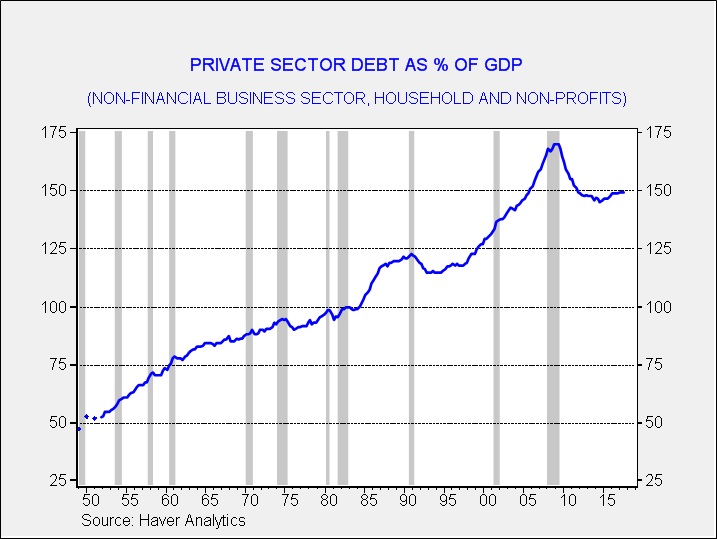
This chart shows key private sector debt as a percentage of GDP. We exclude the financial sector to avoid double counting. We consider private sector debt more important to the economy for two reasons. First, business sector investment is funded with debt and household sentiment is also tied to debt. Leverage will boost growth, while deleveraging weighs on growth. The other important factor is that private sector debt has different capacity constraints than public sector debt. Private sector debt has to be serviced from income or revenue; the private sector cannot print its own money to service its debt. The public sector can not only print money to service its debt, but it can use coercion to force compliance. That is why government debt is a profoundly different risk to the economy; a large deficit is mostly an inflation risk, not a default risk. When the private sector deleverages, it must either write down the debt (harming creditors) or create increased saving (harming debtors). The current expansion is long in duration but growth has lagged previous growth periods in part because of deleveraging. The above data suggests that the private sector has mostly stopped reducing debt relative to the economy but isn’t releveraging, which would tend to increase growth.
The other chart we closely watch is net saving by sector.
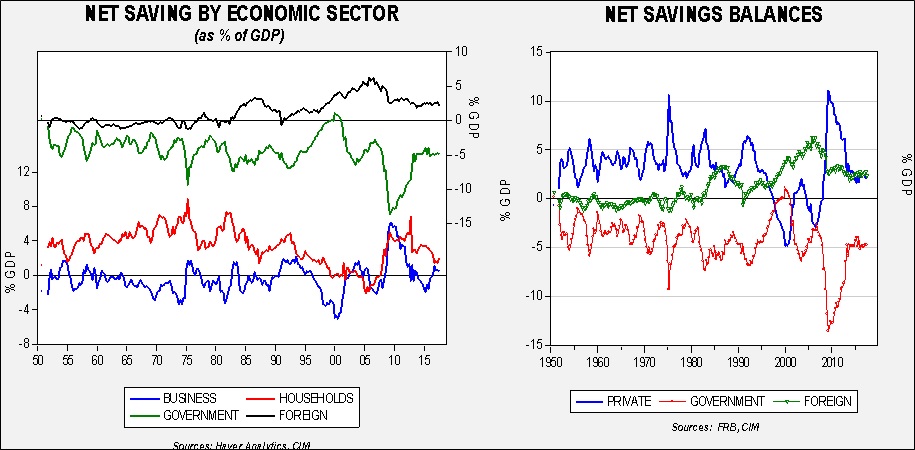
The chart on the left shows net saving by the four sectors of the economy—business, households (which represent the domestic private sector), government and the foreign sector. They have been scaled to GDP. Business saving is revenue less investment. Household saving is income less consumption. The government sector is the fiscal balance and foreign saving is the inverse of the current account. For macroeconomic accounting, the four act like a balance sheet—the net sum always equals zero. For the past few quarters, saving by sector has been mostly steady. The combination of domestic private sector saving and foreign saving has been balancing the government’s deficit. That is best observed on the chart on the right side.
One of the less discussed ramifications of the current tax bill is that it is expected to raise the government’s deficit; in other words, government dissaving must rise. This must be offset by either rising domestic private sector saving or foreign saving (in other words, a rising trade deficit). One of the other policy goals of the Trump administration is to lower the trade deficit but the tax bill may actually foster a wider deficit. At the same time, if the administration meets that goal, domestic private sector inflation must rise. If it is to come from the business sector, investment must fall without a significant rise in business revenue. Of course, rising business investment is a key goal of the tax bill. The other way saving could rise is from higher household saving, but that would likely come from lower consumption which would weaken growth. That’s why getting a revenue-neutral tax bill was so important. If the tax bill were revenue-neutral and simply improved efficiency through tax reform, investment could rise and perhaps be funded without a drop in business saving due to higher revenue.
Finally, net worth of households has reached a new record high.
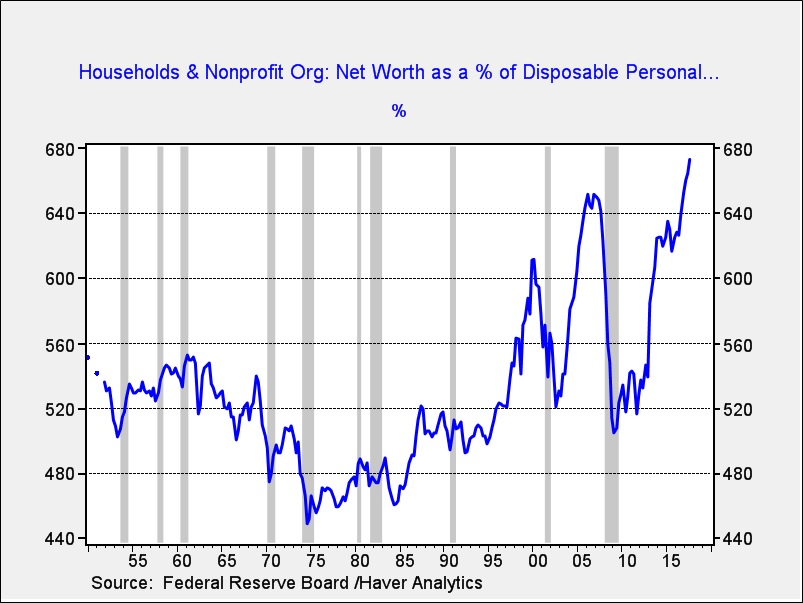
Household net worth is now 673.0% of after-tax income, a new record. The current level reflects rising equity markets and improved housing prices. The chart does indicate that this number tends to fall rather abruptly during recessions. As we noted in our 2018 Outlook, we do not expect a recession next year so this ratio probably has further to rise.
Overall, the Financial Accounts of the United States paints a picture of stability and slow healing. Saving and debt are stabilizing and net worth is rising. We will be watching how the tax bill affect this stability in the coming months.