

Asset Allocation Weekly (December 14, 2018)
by Asset Allocation Committee
Equity markets have come under pressure this autumn. The weakness has gained momentum in recent weeks.
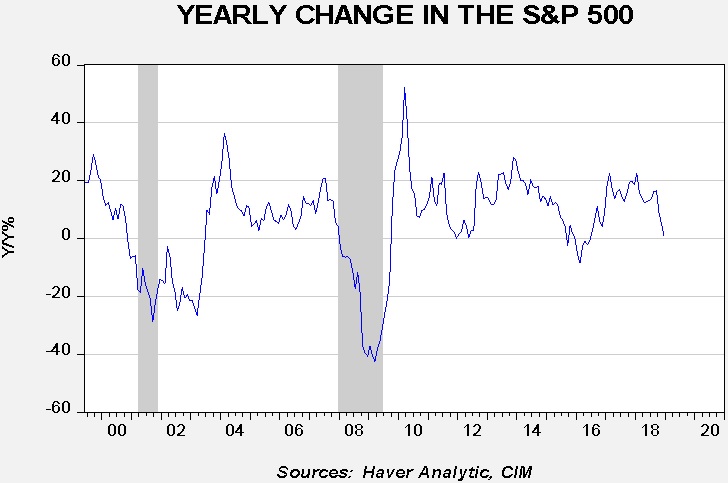
This chart shows the yearly change in the S&P 500 Index on a monthly average basis. We have added recession shading; in general, recessions tend to trigger bear market declines of 20% or more. In fact, every decline of this magnitude has been associated with a downturn in the business cycle since the 1987 Crash.
There have been two sources of recent weakness. The first is fear that the Federal Reserve will make a policy error and trigger a recession. These fears are not unfounded. Since the mid-1950s there have been 13 tightening cycles; only four have resulted in a “soft landing,” a cycle that didn’t trigger a recession.
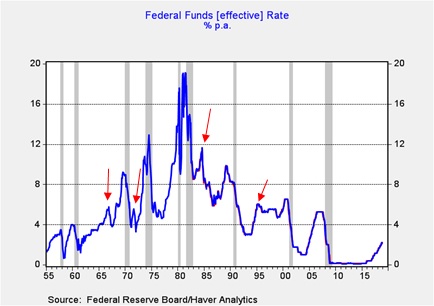
This chart shows the path of fed funds since 1955, shortly after the central bank became independent of the Treasury. We have placed arrows where tightening cycles didn’t bring a downturn. As the chart shows, it’s rare for the Fed to avoid a downturn. It should be noted that the second arrow coincided with the Nixon price and wage freeze; Chair Burns likely lowered fed funds in response to the price freeze. Thus, we can make the case that there were only three soft landings that were independently engineered by the Fed.
The second concern is over trade policy. The administration’s trade policy threatens to disrupt supply chains tied to China which could lead to shortage and higher prices for various goods. The impact of this outcome is very difficult to estimate; we haven’t had an aggressive policy of trade impediments since the 1920s. At the same time, it should be noted that trade frictions are partly a negotiating stance. These issues can be adjusted given the economic and political climate. Since next year is the last full year before elections, we would not be surprised to see some moderation of the Trump administration’s stance on trade policy.
If the FOMC does manage to bring a fifth soft landing and we see some moderation of trade policy, the equity market may be poised for a recovery. Since the late 1990s, the ISM manufacturing index has been a reasonably good indicator of the S&P 500.
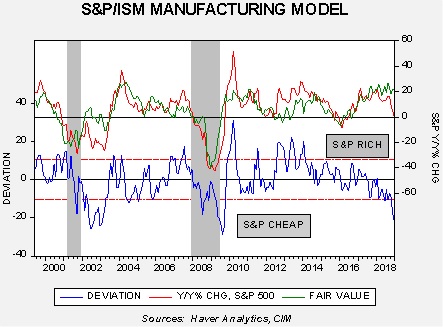
This chart compares the yearly change in the S&P 500 Index monthly average against the ISM Manufacturing Index. The equity index, relative to the perspective of U.S. manufacturing purchasing managers, should be up 22.1% from last year; that would put the index at 3259.27. Not only that, but the current reading is at levels consistent with recession. This analysis suggests that if recession is avoided in 2019 then the equity market could be poised for a strong recovery. Essentially, this model is saying there is a disconnect between the economy and equities. These disconnects occur occasionally but the current one stands out as extreme. Therefore, there may be more risk to reducing equity exposure in the current turmoil.