

Asset Allocation Weekly (August 28, 2020)
by Asset Allocation Committee | PDF
As people think about the supplemental federal unemployment benefit of $600 per week that was in place through July, most would assume that if the total benefits exceed a person’s actual wages, they will choose to be unemployed instead of accepting employment. Anecdotal reports suggest that companies are running into this problem. In fact, Dallas FRB President Robert Kaplan, in an interview with Bloomberg’s Mike McKee, noted that he was hearing of this problem from his business contacts in the 11th Federal Reserve District. However, he also noted that there was little evidence in the data of this phenomena. So, why isn’t this seen in the data? The answer may have something to do with a person’s economic outlook.
Accepting unemployment benefits, even with the added booster, may be a costlier choice than most people realize. Because employment benefits are temporary, people must weigh whether it is in their best interest to accept benefits with the opportunity cost of giving up work tenure and experience, even at lower compensation compared to not working. During an expansion, it might make sense to accept benefits, especially if it comes with a booster, as people would have an easier time finding work once the entitlements run out. However, the same is not true when an economy is in recession.
In a recession, having a job provides workers a relatively reliable and potentially long-lasting source of income during a time of uncertainty. Unemployment benefits, particularly with the added booster, are not only temporary but are also subject to change. Hence, workers may be less receptive to generous benefits if they suspect that a job won’t be available when they need it. This dilemma may partially explain why many economists failed to find conclusive evidence in the data to suggest that getting rid of the added benefits would lead to lower unemployment.[1], [2]
Our own research found evidence to suggest that the opposite may be true. Looking at the top 10 states by the number of continuing claims, we found that unemployment benefits and the unemployment rate were inversely correlated. Thus, the more generous the benefits, the lower the unemployment rate. One possible explanation for this inverse relationship may be due to the fact that people who live in or near a megalopolis are more confident in finding new opportunities than people who don’t, hence people living in those areas are more likely to accept the benefit.
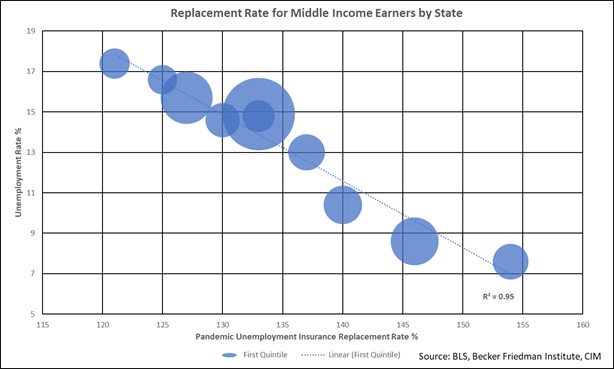
The chart above shows the unemployment rate and the pandemic unemployment insurance replacement rate by state.[3] The bubble size represents the amount of people receiving unemployment benefits. Eight of these 10 states, listed on the above graph, are the highest in population and the two that are not, New Jersey and Massachusetts, are near major population centers. It is possible that employment opportunities are better in these larger states.
In no way are we arguing that higher unemployment benefits will lead to lower unemployment. In fact, the full chart,[4] which includes all 50 states, clearly shows that the unemployment rate and the replacement rate are uncorrelated. However, this chart may be a reflection of workers’ unwillingness to turn down a job today when there is no guarantee that there will be a job in the future.
This thesis is further supported by the jobs report. From May through July, the industries offering the lowest average weekly wage saw the biggest expansion in their respective payrolls. In fact, the two lowest-paying industries, “leisure and hospitality” and “retail trade,” accounted for nearly 60% of the jobs created in that time frame. Therefore, wages clearly aren’t being prioritized for those choosing to return to work.
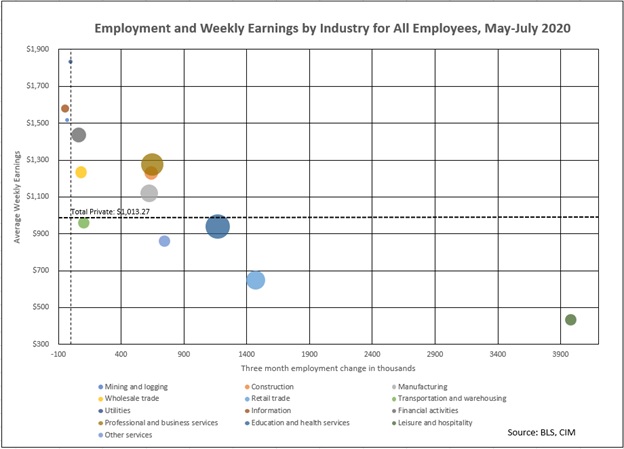
The chart above shows the average weekly earnings and the three-month change in employment by industry. The size of the bubble represents the employment level. With the exception of transportation and warehousing, every industry in which average weekly earnings were below the national average added more jobs than the industries in which average weekly earnings were above the national average.
We are clearly in the midst of an anomalous event. As a result, things may not always be as they appear. If we were to push both charts to their logical conclusions, it would suggest that the key to bringing down the unemployment rate would be for the government to raise unemployment benefits to infinity and for employers to reduce wages to zero. That conclusion would clearly be absurd. That being said, it does suggest that lawmakers and policymakers alike should be cautious when deciding whether to scale back stimulus as it will likely have unknown and unintended consequences. Under normal circumstances, when jobs are easy to get, taking a break to collect outsized unemployment benefits might be an attractive option. But, if jobs are scarce, there is a risk to not returning to a job. Anecdotal evidence is true as far as it goes, but may not be generalizable, so policymakers should exercise care in shaping policy based on “what they are hearing.” The consensus among economists is that the supplemental benefit likely does more good than harm as it contributes to consumption spending.[5] In summary, the costs of the higher supplement to unemployment insurance may be lower than generally believed in terms of discouraging employment, and it may have an outsized impact on consumption if it is reduced.
[1] https://tobin.yale.edu/sites/default/files/files/C-19%20Articles/CARES-UI_identification_vF(1).pdf
[2] https://www.wsj.com/articles/economists-vs-common-sense-11596398926
[3] The pandemic unemployment insurance replacement rate is calculated by dividing the amount of insurance employment benefits plus the booster divided by the average weekly rate by state.
[4] Included in this week’s AAW chart book.
[5] https://www.wsj.com/articles/wsj-survey-benefits-of-extra-unemployment-aid-outweigh-work-disincentive-11597327200?st=y030ojqt1zyug3h