

Asset Allocation Weekly – This Recovery is Different (August 27, 2021)
by the Asset Allocation Committee | PDF
Since the Federal Reserve was granted independence in 1951 there have been 11 recessions. Although each recession and recovery are somewhat unique, analysts tend to compare them for clues about future economic activity and policy actions. In terms of monetary policy, Chair Powell has staked out a dovish path, suggesting that the first rate hike may not occur until 2023. However, recent comments from Fed officials suggest the chair’s position is becoming increasingly isolated.
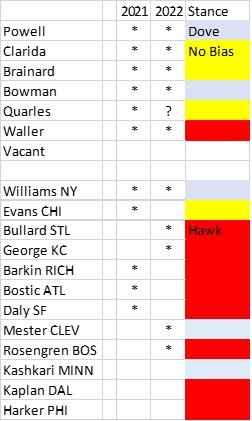
On this table, voters are designated by stars. Currently, there are five committed doves on the FOMC. We expect the no-bias camp to vote for stimulus reduction next year at the earliest. The hawks, on the other hand, are committed to moving this year. Although we could see a rise in dissents later this year, we suspect that policy will remain steady until 2022.
Next year could be interesting, to say the least. Powell’s term as chair ends in February and Quarles’s term as vice chair for regulation ends in October 2021. His full term as governor extends to 2032; although it is customary for a governor to step down once a vice chair position ends, Quarles has indicated he will stay around for a while. If the no-bias group shifts to tightening, Powell may have to tighten or face losing a vote.
Monetary policy in recoveries and expansions has varied over the years. Prior to 1982, it wasn’t always clear from the behavior of fed funds alone whether policy had changed. To estimate changes, we can also use the New York FRB discount rate as an indicator.
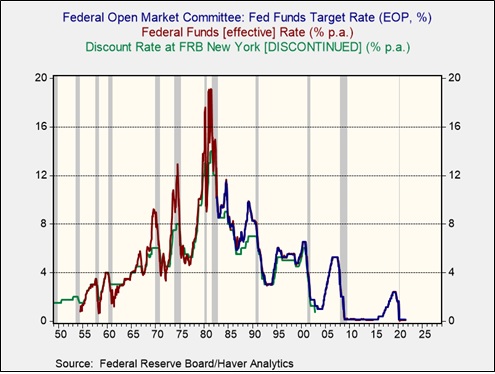
Looking at the recessions from 1955 (the first after independence) onward, what is striking is that the FOMC often moved to raise rates rather quickly after the recession ended. During the seven recessions, the average number of months from the end of the recession to the first rate hike is 13 months. In the past three, the average is 48 months. It has been four decades since the FOMC raised rates quickly into a recovery. For three decades, investors have become accustomed to the slow withdrawal of stimulus.
However, this recovery appears to be much different than the past three. In part, the recovery has been stronger due to massive fiscal and monetary policy support. But another factor is that the recession, although short in duration, was unusually deep. Although sometimes deep recessions have “L”-shaped recoveries, this one did not. One way to see this is by comparing job openings to the number of unemployed workers.
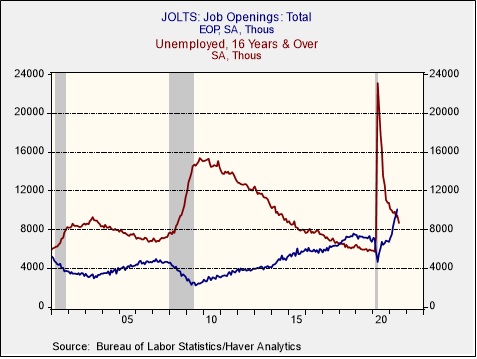
During the entirety of the recovery from the 2001 recession, the number of unemployed exceeded job openings. In the previous recovery, it took until March 2018, almost nine years after the recession ended, for openings to exceed the number of unemployed. In the current recovery, we crossed that line in May, 13 months after the last recession ended.
Unfortunately, the JOLTS report, which measures job openings, started in 2000, so it doesn’t provide a long-term history. The Conference Board had a series where it measured help wanted ads relative to the number of unemployed. It was discontinued in 2010. Although that number is a ratio based on an index, we created a model from the JOLTS report that approximates the help wanted/unemployed ratio to the present.
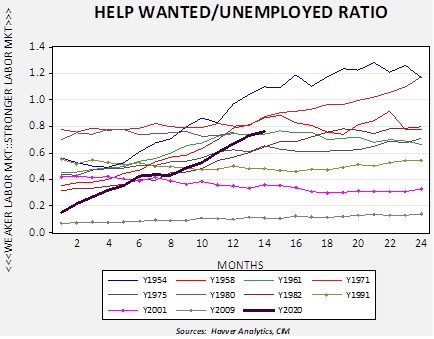
Comparing the behavior of the help wanted/unemployed ratio from the end of every recession since Fed independence, the current recovery is acting more like the pre-1990 cycles. We have denoted the past three with dots on their lines and it is notable that the labor market didn’t improve over the two years after the end of the recessions. So far, the FOMC leadership is acting as if this recovery is similar to the past three cycles; if it is not, policy will likely need to tighten much faster than the market expects.