

Asset Allocation Weekly (August 23, 2019)
by Asset Allocation Committee
Recession worries have increased due to falling long-duration interest rates and the short-lived inversion of the two-year/10-year T-note spread. Although this spread is important, it is merely one in a whole series of permutations of the yield curve. Our preferred measure is the 10-year/fed funds spread because it measures the long end of the yield curve to the policy rate and thus should provide a clearer picture of whether or not the central bank policy is too tight. It is also the same spread the Conference Board uses in its leading economic indicators.
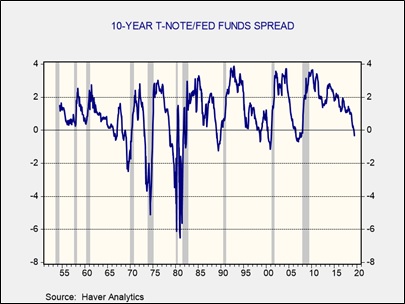
This chart shows the aforementioned spread. Since the 1970 recession, the spread has inverted before every recession. It did have two false positives, one in 1966 and another in 1998. The recent inversion could be a false positive as well, but it makes sense that investors should be concerned about a recession. This is because equities often decline during recessions; in some cases, the drop is significant.
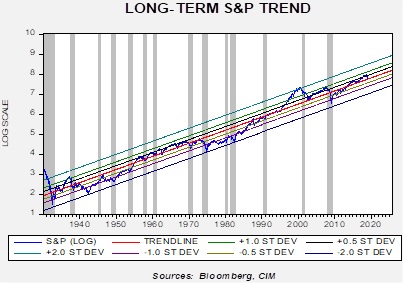
This chart shows the weekly Friday close for the S&P 500 on a log scale. We have regressed a time trend through the data. In nearly all recessions, some weakness in equities is observed, although often the decline in stocks predates the recession to some degree.
This chart shows the performance of the S&P 500 around inversions. We took every inversion from 1966 forward, indexing the S&P to 100 at the month of inversion.
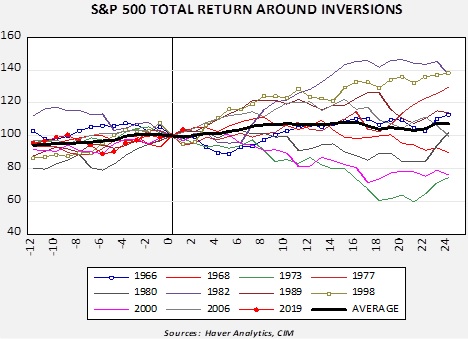
We added symbols to the 1966 and 1998 inversions as both were false positives for recession. In the former case, equities fell in the first 10 months of inversion but rallied. In 1998, there was a brief drop followed by a strong rally in stocks. Generally speaking, false positives are buying opportunities. All the other events were eventually followed by recessions. However, as the data shows, the dispersion is remarkably wide. It’s hard to ascertain a clear message with this much noise, but, in general, a case can be made that a delayed recession after inversion tends to support equity values. The other message is that valuations and inflation issues do matter around inversions. The worst performing markets in the two years after an inversion was 1973, a bear market that suffered from falling margins and multiples, and 2000, which was a highly overvalued equity market. Other than these lessons, the data tends to support the idea that panic around an inversion is probably unwise, which is what the average of all the events tends to suggest. Each inversion has specific characteristics that affect equity market performance. In the current environment, we would be most concerned about profit margins; if a recession occurs, we would expect margins to contract which would likely trigger a notable bear market. So far, margins have declined but remain historically elevated. Margins will likely be the key to equity performance in the coming quarters.