

Asset Allocation Weekly (April 26, 2019)
by Asset Allocation Committee
One of the age-old problems of analysis is the problem of correlation versus causality. Correlations simply show the degree of relation; the range runs from -1 (perfectly negative) to +1 (perfectly positive). In any introductory statistics class, the instructor will discuss the difference between relation and causality. Here is an example:
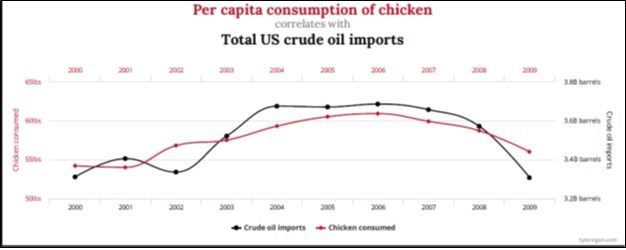
Although it might be possible to concoct a reason why chicken consumption would be related to crude oil imports, in reality, the relationship is spurious.
The advent of cheap computing power has given rise to data mining that allows researchers to scan massive amounts of data and find relations. In fact, some in the tech industry tend to believe that theory is unnecessary—simply find the relationships and assume they will continue. However, without theory, if the relationship breaks down then there is no way of knowing why it fell apart.
This chart has started making the rounds in reports:
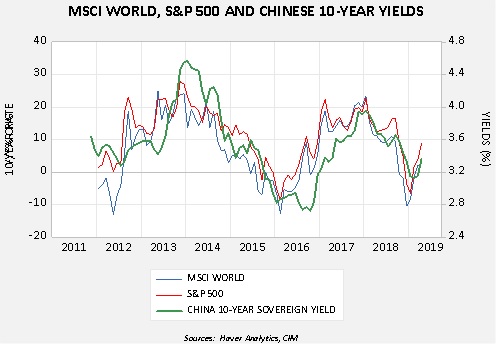
This chart shows the 10-year Chinese sovereign yield with the yearly change in the S&P 500 and the MSCI World Index. Casual observation would suggest they are closely related; in fact, the correlation between the Chinese bond yield and the MSCI is 66.7% and 72.1%with the S&P 500. What’s implied is that developed world stock markets are dependent on Chinese yields. One would expect Chinese yields to rise with better growth in China, and this would suggest that foreign economies, and thus their markets, depend on Chinese growth.[1]
Perhaps. But it is also possible that Chinese interest rates are sensitive to world growth; therefore, when the developed world economy does better so does the Chinese economy, and the improvement leads to higher yields in China. In other words, the direction of causality is difficult to ascertain.
Often, relationships such as this occur because of some other, unnamed variable. Consequently, in the above case, all three are related to a fourth variable. Since 2014, for example, Chinese bond yields have been closely correlated to the dollar.
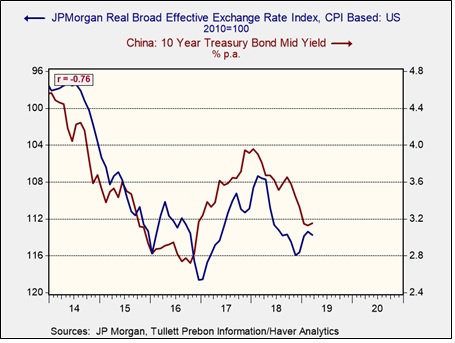
On this chart, the JPM Dollar Index is shown on an inverted scale. When the dollar strengthens, Chinese yields tend to fall; during periods of dollar weakness, the CNY yields rise. Since China tends to manage the CNY/USD rate, it’s plausible that when the dollar weakens China enjoys the benefits of that weakness by allowing the CNY to weaken as well. A weaker currency boosts China’s exports and leads to higher interest rates. And, a weaker dollar tends to support both the above stock indices. Therefore, the dollar’s impact probably explains the relationship between Chinese bond yields and developed market equities.
Finally, one last word of caution. In regression analysis, the dependent variable = intercept + independent variable + error term. The error term, in theory, contains a myriad of variables that we assume, under the majority of circumstances, balance each other out and thus allow for the model to be stable. In reality, the variables not specifically delineated in the error term can emerge and affect the dependent variable; sometimes this occurs only for a short time but can make forecasting a challenge. Given the short history of the above, it is possible that conditions could change and the relationship completely breaks down. Thus, the moral of the story is that conditions do change and investors need to be cognizant of that fact and try to adjust accordingly. And, one needs to be careful of seemingly clear charts.
[1] Granger causality testing tends to support the idea that Chinese yields drive equity market performance. Although statistically sound, Granger causality testing is atheoretical and thus not necessarily causal.