

Asset Allocation Bi-Weekly – Why We Are Keeping Duration Short (May 8, 2023)
by the Asset Allocation Committee | PDF
Financial markets are complicated, and when faced with complication, there is an incentive to simplify. This simplification process takes on several forms, including narratives, bromides, adages, etc. Even the modeling process is a form of simplification. Sayings like “don’t fight the Fed” or “cash is trash” are often heard in the financial media. These adages aren’t always true, but they are true often enough to be believed.
One less common position is “buy long duration in fixed income when the yield curve inverts.” At first glance, this idea seems illogical. If long-term interest rates are below short-term interest rates, buying the former means a lower rate of return. However, total return in fixed income isn’t just about the interest rate—it’s also about price changes. Since yield-curve inversion is a credible recession signal, a downturn in the economy usually leads to lower inflation and rallies in long-duration debt. So, there is evidence to support the saying.
In our recent Asset Allocation rebalance for Q2 2023, we didn’t follow this adage and instead kept duration short in our fixed-income allocations. In this report, we will explore the rationale behind this decision. Our position is that we have entered a secular bear market in long-duration fixed income, which means that, over time, we expect long-term interest rates will rise.
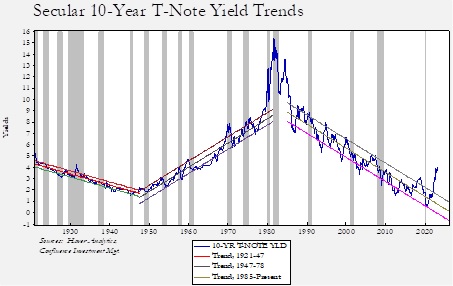
The above chart overlays 10-year Treasury yields with stylized standard deviation trendlines for the periods shown in the chart legend. Note that we have significantly violated the trendline from 1985 to the present. We believe this “breakout” signals that a new trend is being established in this instrument and that trend will be for higher rates. Also note that 10-year yields peaked in 1980.
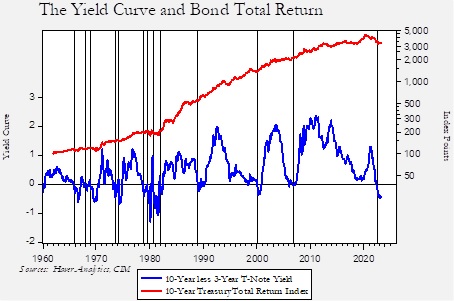
The above chart shows the total return index for the 10-year T-note and the 10-year less three-year T-note yield spread. We are using this yield curve instead of the more familiar two-year/10-year spread because the three-year T-note has a longer history. It should be noted that there is little difference between the two yield curves when their time frames overlap. We have denoted sustained inversions with vertical lines. The table below shows the total return over three-month, six-month, one-year and two-year periods after inversion.
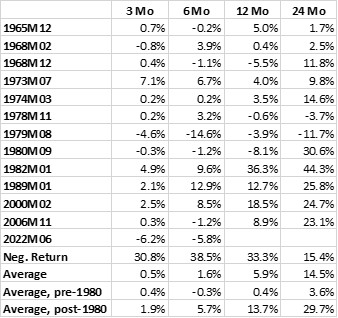
As the data shows, about a third of the time inversions led to negative returns for the 10-year T-note. With a two-year holding period, the negative events fall to about 15%. The 1979 inversion was the only one that yielded a negative return over the two-year time frame. So far, the current inversion has yielded negative total returns.
Over the entire time frame, the average return is positive. However, when we calculate the pre-1980 and post-1980 (excluding the current event) periods, it’s obvious that using the signal of yield-curve inversion to extend duration is a bull market feature. In other words, once interest rates peaked in the early 1980s, bond yields steadily fell.
Looking at the rolling two-year returns is one way to confirm that the secular bull market in bonds was the key factor that supported extending duration when the yield curve inverted. From 1962 to the present, the average two-year return on the 10-year T-note was 13.6%. From 1962 through 1979, the return was 7.2%, whereas from 1980 to the present, it rises to 16.4%. A similar exercise for the five-year T-note yields an overall average two-year return of 12.4%. From 1962 through 1979, the return was 10.1%, whereas the return was 13.2% from 1980 to the present. This suggests that when secular market trends are bearish, shorter-duration positions should perform better than longer-duration positions.
One of the early lessons an economist learns is that some models are initial-conditions-sensitive. In other words, a relationship is often dependent upon a set of circumstances that may not fully be captured by a model. Some of these variables might be psychological or social, and thus are not easily encapsulated numerically. Secular trends can be taken for granted, and when they turn, investing patterns that worked for a long time suddenly fail to deliver. If our assumption about the trends in long-term interest rates are correct, then we believe that remaining in short-duration fixed income is prudent.