

Asset Allocation Bi-Weekly – Examining the Rise in T-Note Yields (August 28, 2023)
by the Asset Allocation Committee | PDF
Perhaps the most interesting market event this month has been the rapid jump in 10-year Treasury note yields. At the end of May, the 10-year Treasury was yielding 3.64%, but recently the yield hit 4.36%. What’s behind this jump? Here are a few reasons behind the rise:
- Treasury borrowing is expected to increase with more supply coming into long-duration paper.
- The Bank of Japan is slowing giving up on yield curve control which will mean higher rates for Japan’s government bonds.
- Expectations of a recession in the U.S have dissipated; in fact, the recent GDPNow estimate from the Atlanta Federal Reserve Bank for this quarter’s real GDP is a whopping 5.8%.
All these reasons are valid. Our position has been that the 10-year Treasury yield has been too low for some time with the primary reason being that the market has been expecting the policy rate to decline faster than was likely.
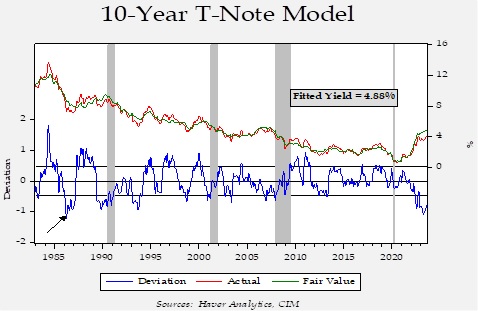
This chart shows our 10-year T-note yield model; its components include fed funds, the 15-year average of CPI,[1] the five-year standard deviation of inflation, German and Japanese 10-year yields, oil prices, the yen/dollar exchange rate, the fiscal deficit/GDP, and a binary variable for unified government. When the deviation is negative, it suggests the current yield is below fair value. As the chart shows, the current fair value is a yield of 4.88%.
Our analysis suggests the 10-year yield, even with its recent rise, is discounting a fed funds target of 3.40%. Such a rate is certainly possible but, barring either a financial accident or a rapid decline in economic growth, the FOMC has been signaling it will keep policy steady for an extended period of time. In other words, it may take a long time before the policy rate falls to this level. Despite these comments from policymakers, financial markets are still expecting the FOMC to cut rates.
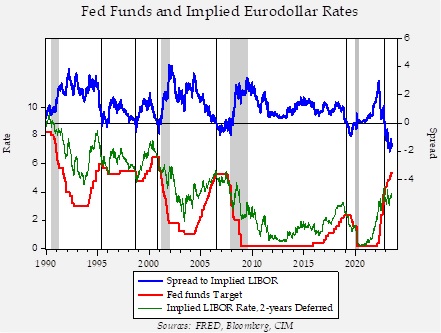
This chart compares the fed funds target to the implied LIBOR rate, two-years deferred. With the demise of LIBOR, we have grafted the SOFR futures implied rate to the LIBOR rate. The upper line shows that the fed funds rate remains well above what the market is forecasting for short-term interest rates over the next two years. The market’s positioning isn’t unreasonable, as a recession will occur at some point. Although the onset has been delayed, with reasons discussed in our Q3 2023 Asset Allocation Rebalance Video, a downturn is still possible in the coming year. In the meantime, given how “rich” current 10-year T-note yields are relative to our model, we believe it is hard to make a case for extending duration.
On the 10-year T-note model chart, we have placed an arrow that shows the last time yields were this expensive. That period was 1986, and long-duration yields had plummeted due to a collapse in oil prices. As oil prices recovered, long-duration yields jumped. Although that period isn’t a perfect analog to the present, it does suggest that in the absence of recession, there is ample room for long-duration yields to rise further. Generally speaking, the longer the next recession is pushed into the future, the greater the odds that long-duration yields will rise further. Based off this analysis, we expect to favor shorter-duration fixed income until conditions change.
[1] We use this as a proxy for inflation expectations.
There will be no podcast for this week’s report.