

Asset Allocation Bi-Weekly – The Inflation Surprise (August 22, 2022)
by the Asset Allocation Committee | PDF
July inflation came in below expectations. On a yearly basis, the market expected an overall rate of 8.7%, while the actual reading was 8.5%. For core CPI, the actual was 5.9% compared to expectations of 6.1%. Perhaps the most bullish part of the report was the monthly change, where the overall rate was unchanged compared to June and the core rose by 0.3% compared to expectations of a 0.5% rise. This was the first monthly reading for the overall rate that was zero or less since May 2020.
The reaction of financial markets was swift and bullish. The S&P 500 rose over 2% on Wednesday, August 10. The dollar fell, commodities mostly rose, and the short end of the yield curve rallied. Why the strong reaction? The July data was the first time in months we have seen a modest rise in inflation and there is hope that we may be past “peak inflation.” This hope may be fulfilled. It’s clear the U.S. economy is slowing and there is evidence that supply chains are slowly improving.
Is this optimism justified? Although the news on inflation was positive, comparing the policy rate relative to CPI and unemployment suggests the FOMC still has a long way to go before achieving a neutral rate.
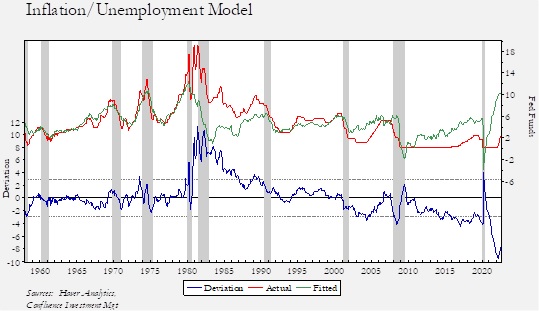
In the above chart, the independent variable is CPI less the unemployment rate. The blue line shows the difference from the model’s estimation of what the policy rate should be based on the difference between CPI and unemployment. Since 1957, the Federal Reserve has never conducted a policy this easy. Although recent tightening has somewhat narrowed the gap, the FOMC needs to see either a rise in unemployment or a sharp drop in inflation.
Financial markets, in contrast, are anticipating an end to this tightening cycle. Comparing the implied interest rate from the Eurodollar futures market, two years into the future, suggests the Fed will be easing in the coming months.
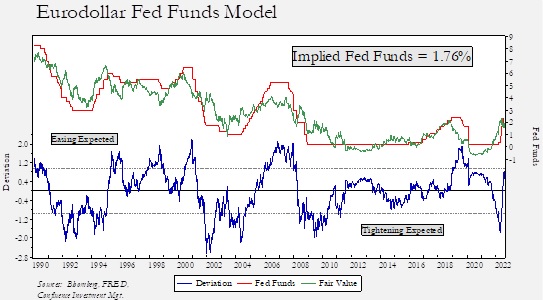
Eurodollar futures are already projecting a lower rate over the next two years. We have not reached the extremes of earlier tightening cycles, but another rate hike of 50 bps will push the deviation into easing territory.
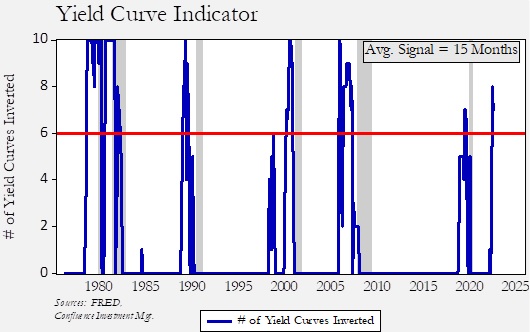
So, why the difference in the two models? The financial markets are anticipating a change in economic conditions, either falling inflation, rising unemployment, or both. Why? In part, it’s because the financial markets are anticipating recessionary conditions. For example, the yield curve has inverted. The chart below depicts a study that looks at 10 different Treasury yield curves. History shows that when more than six of these curves invert, a recession occurs, on average, in 15 months. In July, eight of the curves inverted. As an aside, note that it is common for these curves to steepen after the inversion but before the recession develops. One should not take any comfort in fewer yield curves inverting once we exceed six.
What is unknown is how fast inflation will fall or unemployment will rise. Our concern is that the financial markets are anticipating a rapid adjustment in the first chart’s indicator that may not be borne out by the data. If that outcome occurs, the FOMC may tighten more than the market expects and maintain that tightness longer than anticipated. That outcome would likely be negative for equities, but for now, hopes of falling inflation and an easing response from policymakers have lifted risk assets. If this positive outcome fails to materialize, a downturn in risk assets is likely.