


Business Cycle Report (November 6, 2026)
by Thomas Wash | PDF
The business cycle has a major impact on financial markets; recessions usually accompany bear markets in equities. The intention of this report is to keep our readers apprised of the potential for recession, updated on a monthly basis. Although it isn’t the final word on our views about recession, it is part of our process in signaling the potential for a downturn.
The US economy expanded further in September, largely driven by AI, though pockets of concern remain. Our proprietary Confluence Diffusion Index slipped back into contraction territory after a brief, one-month stint above the expansion threshold. Because the previous rise was short-lived, this reversal does not necessarily signal an impending downturn; rather, it suggests that even though overall growth remains strong, it may be increasingly concentrated.
Financial Markets
Financial conditions tightened significantly as expectations grew that massive AI infrastructure spending could compete with government borrowing for capital. Longer-dated Treasurys bore the brunt of the selloff, pushing the 10-year yield to a multi-decade high. This upward movement was also fueled by concerns that heavy AI investment would accelerate economic growth enough to rekindle inflation, reinforcing expectations of further Federal Reserve rate hikes. Additionally, heavy equity and corporate bond issuance from major tech firms has intensified market tightness by absorbing liquidity and competing directly with other assets.
Goods Production & Sentiment
Goods manufacturing continues to gain momentum, even as business and consumer sentiment remains mixed. The ongoing AI buildout has sparked a surge in construction activity, boosting manufacturing production. Outside of tech spending, however, signs of sluggishness persist — most notably in the housing sector, where home-building has slowed. Economic surveys show ongoing concern over rising costs for both suppliers and consumers.
Labor Market
The labor market has weakened slightly from the previous month but remains solid. The economy added 29,000 jobs last month, driven by strong growth in construction and healthcare services. Unemployment ticked up to 4.2%, slightly above the previous month’s rate, but still at a level consistent with economic expansion. Initial jobless claims remain well below historical averages, indicating that firms are holding on to their existing workforce.
Outlook & Risks
Growth was robust in the third quarter and should maintain momentum through the end of the year. Heavy investment in artificial intelligence has driven business fixed investment, providing significant support to the broader economy. Over the coming months, this spending is expected to broaden into other sectors, further bolstering expansion. Consumer spending remains resilient despite tighter credit conditions. While a recession does not appear imminent, we are monitoring a potential slowdown in AI spending as a pullback in the sector could present a key headwind to overall growth.
The Confluence Diffusion Index
for October, which provides a composite view of the economy based on 11 benchmarks, remains in expansionary territory using September data. The index fell from +0.2727 to +0.2121, slipping below the contraction threshold. Despite this slight decline, the broader economy appears to be in solid shape, though underlying growth remains uneven. Currently, only four of the 11 benchmarks are in contraction territory.
- Concerns about the economy overheating are pushing up yields.
- Sentiment remains low but spending continues.
- The labor market remains in “low hire, low fire” mode.
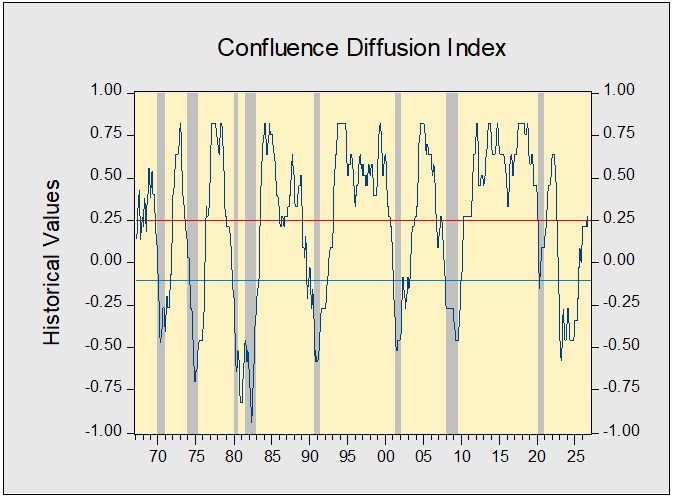
The chart above shows the Confluence Diffusion Index. It uses a three-month moving average of 11 leading indicators to track the state of the business cycle. The red line signals when the business cycle is headed toward a contraction, while the blue line signals when the business cycle is in recovery. The diffusion index currently provides about six months of lead time for a contraction and five months of lead time for recovery. Continue reading for an in-depth understanding of how the indicators are performing. At the end of the report, the Glossary of Charts describes each chart and its measures. A chart title listed in red indicates that the index is signaling recession.