


Business Cycle Report (September 24, 2026)
by Thomas Wash | PDF
The business cycle has a major impact on financial markets; recessions usually accompany bear markets in equities. The intention of this report is to keep our readers apprised of the potential for recession, updated on a monthly basis. Although it isn’t the final word on our views about recession, it is part of our process in signaling the potential for a downturn.
The US economy expanded further in August, showing signs of accelerating momentum. Reflecting this strength, our proprietary Confluence Diffusion Index posted its 19th consecutive month in expansionary territory. Infrastructure buildout driven by AI, along with sustained consumer spending, continues to surprise to the upside. However, elevated interest rates and persistent inflation remain primary headwinds for the current expansion cycle.
Financial Markets
Financial conditions tightened moderately in August amid growing concerns over rising inflation and potential monetary policy tightening, fueled by hawkish comments from the Fed. During his Jackson Hole address, Fed Chair Kevin Warsh noted that the economy was showing signs of overheating, signaling that the central bank may need to act. The tightening was primarily driven by higher short-term interest rates, while long-term rates were relatively unchanged. Despite these policy concerns, markets held firm as investors remained confident in corporate earnings resilience.
Goods Production & Sentiment
Goods manufacturing was relatively stable last month, though inflation is still a primary concern. The latest ISM report showed that supplier deliveries slowed in August, signaling that production capacity was beginning to stretch. This pressure appears to be driven by reindustrialization efforts, particularly within AI and defense. While growth was solid, inflation continued to weigh heavily on firms and consumers as rising input costs began pushing up goods prices.
Labor Market
The labor market tightened as labor supply shrank while hiring accelerated. The economy added 162,000 jobs last month, the broadest job growth since March, driven by a pickup in local government and construction hiring. The unemployment rate held steady at 4.1%, with a slight rise in unemployed individuals offset by a decline in overall labor force participation. Layoff risks are low as initial jobless claims continue to hover near historic lows.
Outlook & Risks
Third quarter economic momentum remains strong despite broader concerns. The Atlanta Fed’s GDPNow estimate is projecting an annualized 5.1% expansion — the fastest pace since Q4 2021. This acceleration complicates the Federal Reserve’s upcoming policy decisions regarding whether to tighten further to prevent overheating. Although near-term growth projections over the next six months are solid, prolonged elevated interest rates pose a medium-term risk to momentum.
The Confluence Diffusion Index for September, which provides a composite view of the economy based on 11 benchmarks, continues in expansionary territory based on August data. The index’s value rose from a revised +0.2121 to +0.2727 and has risen above the expansion line for the first time since 2022. The index shows that the economy remains resilient in the face of geopolitical shocks and rising interest rates. Only three of the 11 benchmarks are in contraction.
- The hawkish Federal Reserve stance is driving up short-term yields.
- Goods production remains resilient despite persistent inflation.
- Hiring activity has accelerated nationwide.
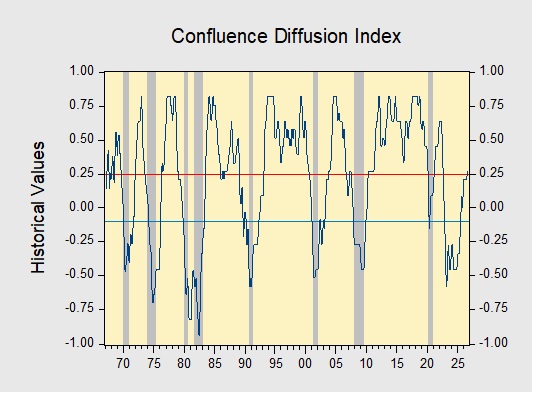
The chart above shows the Confluence Diffusion Index. It uses a three-month moving average of 11 leading indicators to track the state of the business cycle. The red line signals when the business cycle is headed toward a contraction, while the blue line signals when the business cycle is in recovery. The diffusion index currently provides about six months of lead time for a contraction and five months of lead time for recovery. Continue reading for an in-depth understanding of how the indicators are performing. At the end of the report, the Glossary of Charts describes each chart and its measures. A chart title listed in red indicates that the index is signaling recession.