

Weekly Energy Update (August 4, 2022)
by Bill O’Grady, Thomas Wash, and Patrick Fearon-Hernandez, CFA | PDF
Prices are testing long-term support near $90 per barrel for crude oil.
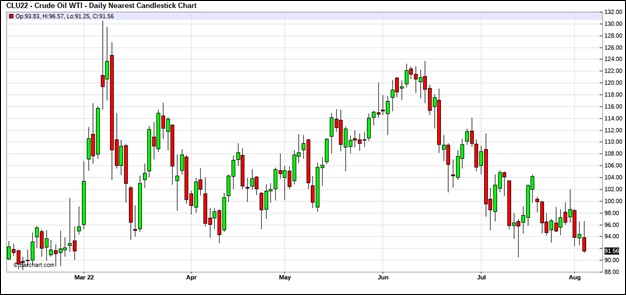
(Source: Barchart.com)
Crude oil inventories rose 4.5 mb compared to a 1.5 mb draw forecast. The SPR declined 4.7 mb, meaning the net draw was 0.2 mb.
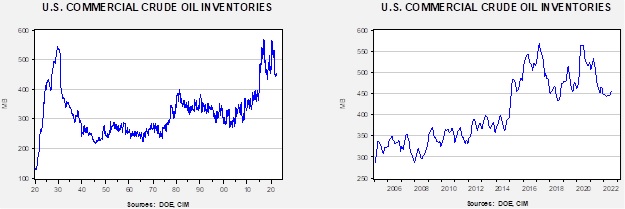
In the details, U.S. crude oil production was steady at 12.1 mbpd. Exports fell 1.0 mb, while imports rose 1.2 mbpd. Refining activity declined 1.2% to 91.0% of capacity.
(Sources: DOE, CIM)
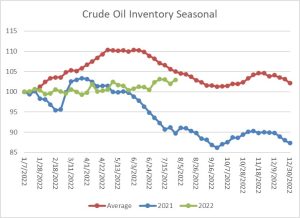
The above chart shows the seasonal pattern for crude oil inventories. Clearly, this year is deviating from the normal path of commercial inventory levels. The fact that we are not seeing the usual seasonal decline is a bearish factor for oil prices.
Since the SPR is being used, to some extent, as a buffer stock, we have constructed oil inventory charts incorporating both the SPR and commercial inventories.
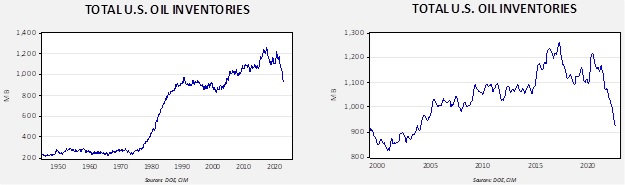
Total stockpiles peaked in 2017 and are now at levels last seen in 2004. Using total stocks since 2015, fair value is $104.04.
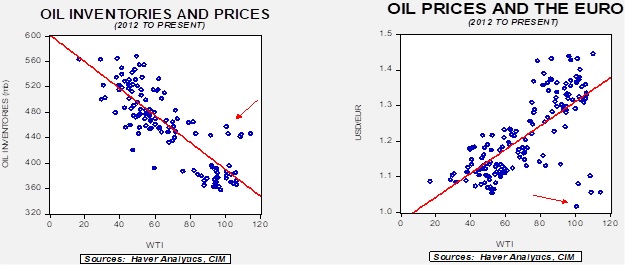
With so many crosscurrents in the oil markets, we are beginning to see some degree of normalization. The inventory/EUR model suggests oil prices should be around $65 per barrel, so we are seeing about $30 of risk premium in the market.
Gasoline Prices
One of the challenges in determining “how high” gasoline prices truly are is to find the proper scaling variable. The most common metric is to deflate the current price by some price index. Although that method is sound (it compares gasoline prices to other items), it doesn’t, in our opinion, capture the centrality of gasoline prices. After all, a commuter often has limited ability to substitute either a fuel (cars tend to only use gasoline) or a travel method (car sharing requires coordination, public transportation varies by locale).
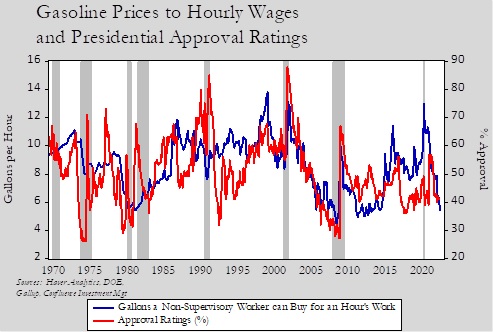
As an alternative to using a price index, we take the nominal hourly wage for a non-supervisory worker and divide into that wage the current average national price of gasoline. This measure calculates how many gallons of gasoline a worker can purchase for an hour’s worth of work. The scaling method isn’t perfect as it doesn’t take into account taxes and benefit costs, for example, but it does allow us to compare the current price to history.
The below chart shows that calculation along with the Presidential Approval Ratings. On the left axis, the higher the number, the more gallons one can buy with an hour’s worth of work. So, the higher the reading, the better off the worker is. Over time, the average is 8.6 gallons. As the chart shows, we are well below that level at present. It’s also clear that Presidential Approval Ratings and the number of gallons one can buy “rhyme.” The two variables are not perfectly correlated. There are several spikes in approval tied to wars or other geopolitical events that sometimes occur with lower gallon per hour readings. But, overall, President Biden’s low approval ratings is not being helped by falling gallon per hour numbers.
Market news:
- The current energy crisis has a multitude of factors behind it. Green power hasn’t come online as fast as hoped, and fossil fuel production has not responded to higher prices for a number of reasons. This article provides a summary, and this podcast, from Odd Lots, highlights the differences between consumer goods (especially technology) and energy products. With consumer tech, when a better product hits the market, the old technology disappears rapidly. That is not the case with energy.
- OPEC+ met this week to set production targets. The cartel agreed to a cosmetic increase of 0.1 mbpd, which fulfills the White House’s goal of an increase, but will not have any significant impact on supply.
- It appears the EU is rethinking its stance on banning insurance firms from selling protection on Russian crude oil shipments. The U.S. has been concerned for some time that the program could unexpectedly reduce sales and drive oil prices higher. The G-7 is considering other measures to reduce the profitability of Russian crude oil without curtailing supply.
- As it has become apparent that Russia is an unreliable supplier of natural gas, Germany is moving rapidly to build LNG regassification capacity.
- In light of the energy crisis, coal has made a dramatic recovery, with global demand set to have a record high in 2022. The EU is reducing Russian purchases on its way to an outright ban.
- West Virginia has banned five major Wall Street banks from doing business with the state over their policies toward lending to fossil fuel companies.
- In periods of shortages, nations often turn to hoarding. For energy producers, the temptation is to reduce exports in order to provide oil, natural gas, or coal at lower prices domestically. Bans can be hard to enforce, and after such actions consuming nations often become hoarders themselves, stockpiling due to the insecurity of supply. When that happens, the relationship between inventory levels and price becomes positive while under normal circumstances, the relationship is negative. So far in oil, that correlation inversion hasn’t occurred yet. We note that Australia is considering mandating a reduction in coal exports, which may be an early warning of hoarding activity. In addition, Australia’s LNG exports might be curtailed to ensure domestic prices remain below global ones.
- Russian LNG supplies to India have been cut, forcing India to ration gas by cutting supplies to industrial users.
- We also note that Russia has signaled to Germany that repairs on Nord Stream 1 are not its responsibility.
- France claims it will have fully filled its natural gas inventories by November 1.
- Demand for hydraulic fracking equipment has been strong, which is leading to constrained supply. The lack of equipment could prevent oil production from rising.
- Power companies report a shortage of key distribution equipment as hurricane season heads into its active period.
- Baker/Hughes (BKR, $25.50) is selling its Russian business unit to a local management team.
Geopolitical news:
- Protestors have stormed the Iraqi Parliament twice recently, due to anger over the potential for a government run by groups other than Moqtada al-Sadr. They are especially upset by the candidacy of Mohammed al-Sudani, who is backed by Iran. The protestors are also calling for a new constitution. The worry is that if the political unrest escalates, it might disrupt oil production at some point.
- Although Iran is pressing to resume JCPOA talks, U.S. officials suggest a deal is “highly unlikely.” Meanwhile, the U.S. is considering expanding sanctions against the smuggling network that is selling Iranian crude oil.
- Iran is trying to improve relations with India, but is struggling to make progress.
- OPEC+ is showing no signs of ending Russia’s membership.
- When a company makes direct investment into a foreign nation, the risk of expropriation exists. Miners are facing such a threat in Kyrgyzstan.
Alternative energy/policy news:
- The “big news” this week was the unexpected agreement between the Democrat leadership in Congress and Sen. Manchin (D-WV) on climate regulation. Although this bill isn’t as ambitious as earlier versions (which Manchin opposed) it is surprisingly expansive. It includes clean energy tax credits for nuclear power, clean hydrogen, and direct carbon capture. Incentives to buy EVs, including tax credits, were included, as were aids for solar power. There are some sticks, too. These include a fee on methane emissions, which could boost the cost of drilling, especially for natural gas. There are also taxes for oil imports. We doubt this bill will get any support from the GOP and it isn’t completely clear it will get unanimous Democratic support. But for now, the agreement is something of a breakthrough, and we will be watching to see if it actually passes.
- We are also closely watching another bill that can’t go through reconciliation but would streamline the permitting process for oil and gas drilling along with pipeline construction. While permitting delays have been a favorite tactic of environmentalists, this bill would put a two-year limit on objections, meaning that the project either get approved or rejected in a shorter time frame. This bill could be filibustered, so it must gain some GOP support.
- Another interesting sidelight is that the bill offers tax incentives for making EVs using minerals from nations with which the U.S. has free trade agreements. Sadly, there aren’t any.
- Even with the aforementioned bill, EVs continue to struggle for adoption. Prices are high since the market for low cost EVs is still rather small. The majority of EVs reside in a handful of states.
- Last week, we noted the unusual weather events we were seeing across the country. It is clear (especially in St. Louis and vicinity) that the infrastructure isn’t adequate for such events. Hot weather continues across the country with some 100 million Americans affected. Although the notion of climate change remains polarized, polling does suggest that unusual weather events are increasingly being tied, in the mind of the public, to climate change.
- As temperatures rise in Singapore, the city-state is investigating various methods to manage heat.
- Farming is a source of greenhouse gases; steers and dairy cows emit CO2, for example. At the same time, they are a source of food. Taking steps to curtail agriculturally based gases will raise food costs – a step that is rarely politically popular. The Netherlands and Canada are considering such steps, triggering a backlash from farmers. Given soaring food prices, these steps appear rather mistimed.
- Lyondell (LYB, $86.50) is closing a refinery in Texas, but is considering repurposing it to process recycled plastic.
- German automakers are turning to China’s Contemporary Amperex Technology (CATL, ¥534.92) for auto batteries for EVs.
- Ganfeng Lithium (GNENF, $9.32) is planning to build a solid state EV battery facility. Solid state batteries hold the promise of longer range and faster recharging.
- Is sand a viable, cheap, alternative to other batteries for utilities? Finnish researchers are testing the concept. The idea is that sand can hold heat and that heat can be tapped for a number of different applications.
- S. regulators have certified a small nuclear design.
- Under hot and dry conditions, wind can falter. Texas is reporting a drop in renewables output, further constraining electricity supply. Interestingly enough, hot weather can also curtail nuclear power. In France, as temperatures rise, river water used to cool reactors becomes too hot, forcing utilities to restrict output.
- Warm weather is also lowering the water level of the Rhine River, nearly closing it to shipping. If it closes, coal shipments might be adversely affected.
- New England utilities are finding that expanding solar capacity is reducing demand during daylight hours.
- Aurora Hydrogen, a startup, is testing the concept of making hydrogen from natural gas with a process that generates no CO2.