

Weekly Energy Update (May 29, 2020)
by Bill O’Grady, Thomas Wash, and Patrick Fearon-Hernandez, CFA
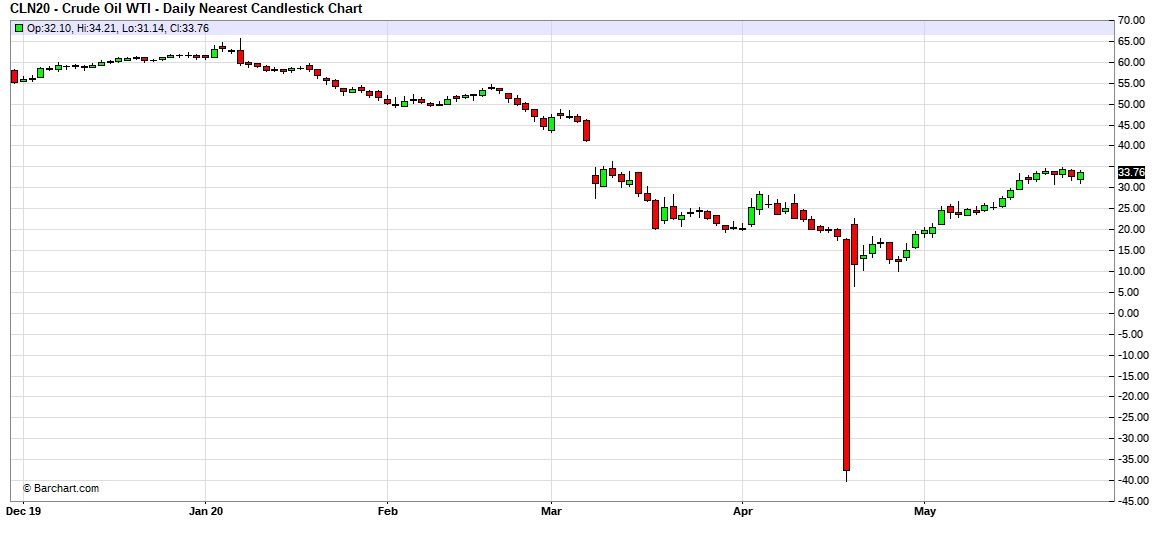
Due to the Memorial Day holiday, the DOE data was delayed until yesterday. Thus, our report was delayed as well. Here is an updated crude oil price chart. The oil market continues to recover after April’s historic collapse.
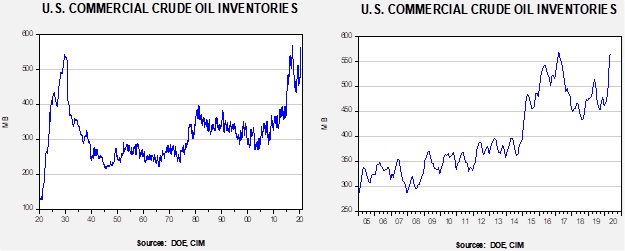
Crude oil inventories surprised the markets for the third straight week but this time by rising 7.9 mb compared to forecasts of a 2.5 mb draw.
In the details, U.S. crude oil production fell 0.1 mbpd to 11.4 mbpd. Exports were unchanged, while imports rose 2.0 mbpd. Refining activity rose 1.9%, above expectations. As we saw last week, there was another jump in unaccounted-for crude oil.
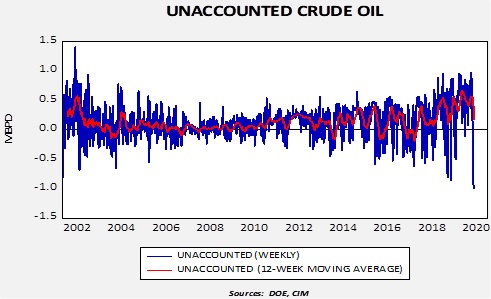
Unaccounted-for crude oil is a balancing item in the weekly energy balance sheet. To make the data balance, this line item is a plug figure, but that doesn’t mean it doesn’t matter. This week’s number of -999 kbpd is the largest negative number on record. For the third week in a row, this number is running nearly 1.0 mbpd. It may mean that in the scramble for finding storage, some oil is being inventoried outside the survey system. In other words, over the week, some 6.9 mb of crude oil went into storage somewhere, just not where it can be recorded. Or, production is falling much faster than the DOE estimates are capturing so there aren’t any missing barrels; simply put, production is cratering. We still don’t know which thesis is correct. Given that imports rose this week, some of the unaccounted-for crude oil may be in storage floating on the ocean and prices have reached a point where some of it is coming ashore. Nevertheless, it is still quite possible that production is falling faster than estimated.[1] The second factor is that the SPR rose 2.1 mb as some of the oil went into the strategic reserve.
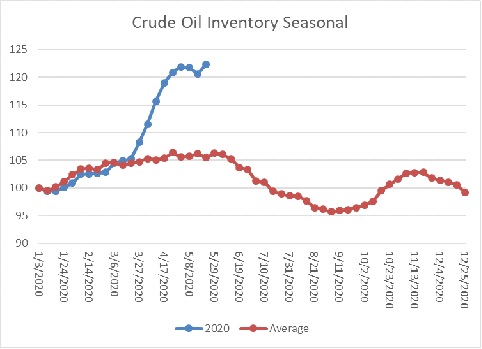
The above chart shows the annual seasonal pattern for crude oil inventories. This week’s data showed a rebound in crude oil stockpiles. We are getting close to the beginning of the seasonal draw for crude oil. If inventories don’t decline in the coming weeks, oil prices would be vulnerable to a correction.
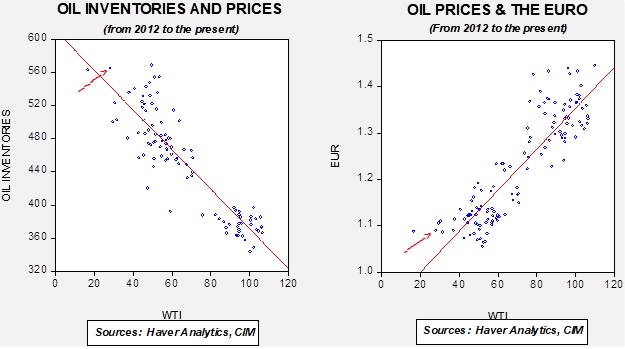
Based on our oil inventory/price model, fair value is $28.43; using the euro/price model, fair value is $44.74. The combined model, a broader analysis of the oil price, generates a fair value of $36.10. As we have noted recently, the model output is less relevant as there is a non-linearity tied to the loss of storage capacity that cannot be fully captured with these models. At the same time, if storage remains available, the models would suggest further upside for oil prices.
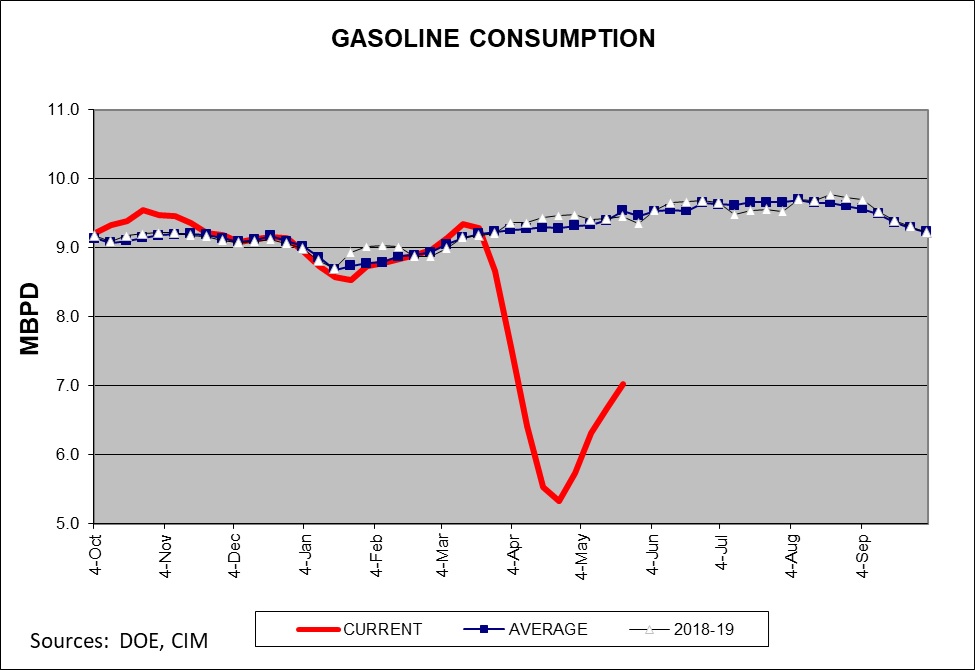
Although consumption remains depressed, there are reports that driving is starting to recover as lockdown rules ease. The gasoline supplied data on the chart below also continues to show improvement. Some data tracking does suggest an upswing in driving activity.
Another way of looking at gasoline is comparing inventories to consumption and calculating how many days of inventory are available at current consumption rates.
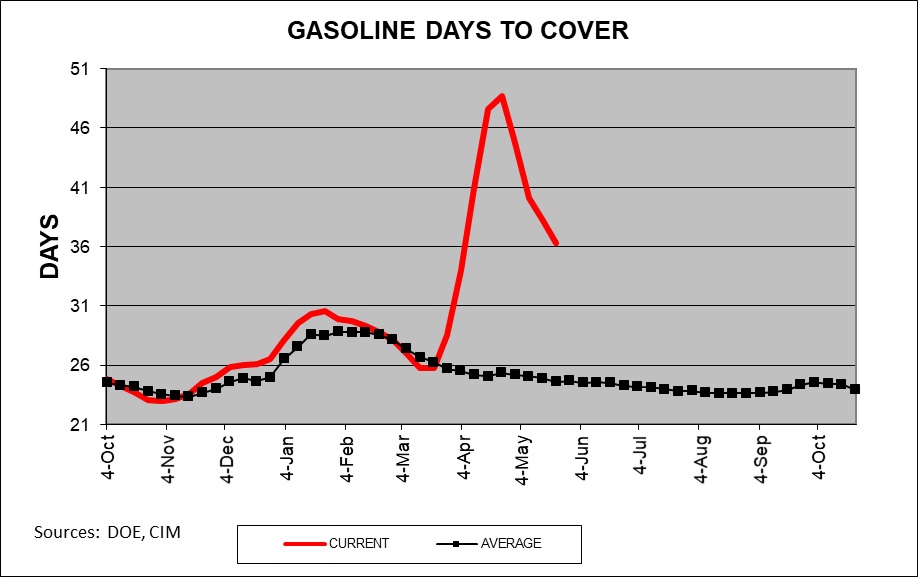
The current level is about 10 days above average. An interesting sidelight is that the drop in gasoline demand has led to a drop in ethanol demand as well. We get carbon dioxide from processing corn for ethanol which is sold to make fizzy drinks, dry ice, etc. The price of CO2 is rising.
In market news, the IEA warned that shale investment would likely halve in 2020. Venezuela received a shipment of gasoline from Iran. Both nations violated U.S. sanctions; so far, there hasn’t been a notable response from the U.S.
[1] The weekly production numbers are estimates. The official data comes with a two-month lag. The DOE data for April indicates that production was 12.7 mbpd…but even that was an estimate.