

Daily Comment (January 25, 2017)
by Bill O’Grady, Kaisa Stucke, and Thomas Wash
[Posted: 9:30 AM EST] After a sluggish start to the year, equity markets have resumed their northward march. There isn’t a whole lot of news to trigger this rise, although the reversal of the Obama policy on pipelines may have lifted hopes that deregulation is really on the agenda. Another factor that might be behind the lift is hopes for infrastructure spending. The Democrats in Congress have suggested a $1.0 trillion spending package; their program has no path for funding. However, we sense that this president isn’t overly concerned about the size of the deficit. We suspect that the Democrats are doing this, in part, as a political ploy, thinking they might break the “Ryan/Trump coalition.” However, it isn’t clear to us that such a coalition really exists. Trump may be sui generis and could be more than open to supporting a massive infrastructure build over the objections of his own party (and strong objections from his appointee for OMB). The KC Star and the McClatchy Washington Bureau[1] report that the president’s team has compiled a list of 50 infrastructure projects costing around $137.5 bn. The fact that his administration is lining up projects surely suggests that he is amenable to infrastructure spending. Would President Trump team up with Democrats over the objections of Congressional Republicans to approve infrastructure spending? We believe this is a distinct possibility.
Who wins? All firms involved in construction and equipment and probably those long the dollar. The losers? Treasury bond investors. A widening deficit and fiscal stimulus in an economy that is arguably near full employment could boost inflation and prompt the Fed to raise rates. Of course, this assumes the FOMC will continue to follow the policy pattern that has been in place since Paul Volcker, which is to quell inflation by raising rates. However, we would not be shocked to see this president try to strong-arm monetary policymakers to keep policy accommodative, similar to the Burns/Miller era of the 1970s. If we get the latter, the dollar weakens, commodity prices rise and long-term interest rates rise as well. This situation is one of the most significant “known/unknowns” that we are watching.
We do note that this topic of slack in the economy isn’t necessarily settled. Yes, the unemployment rate would clearly suggest that the economy has little unused labor resources available. However, the data is not completely clear on this issue.
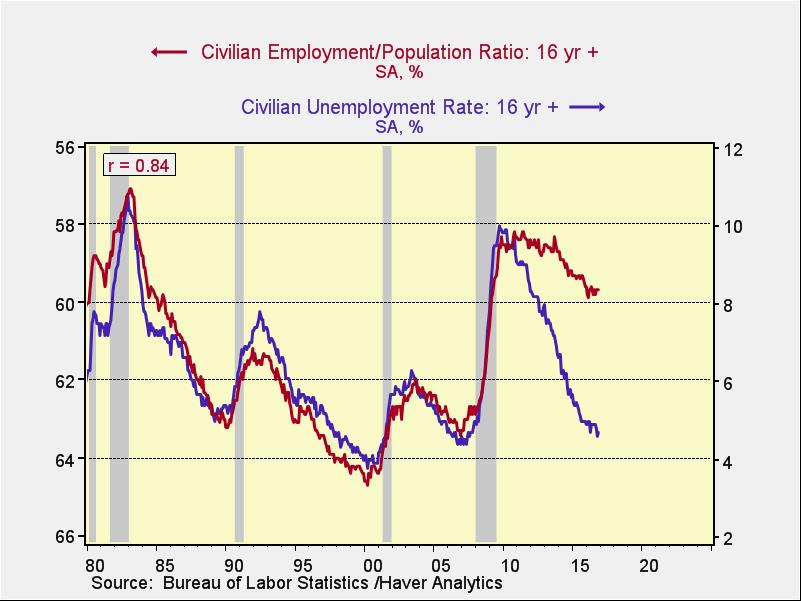
This is one of our favorite charts to measure the problem of determining slack. The blue line shows the U-3 unemployment rate, while the red line shows the employment/population ratio. The two series were highly correlated (+84%) from 1980 until the end of the last business cycle, at which point it has become evident that the relationship between the two series has broken down. This difference is significant; had the relationship remained the same, the economy would have added 8.3 mm more jobs. Why has this divergence occurred? Some of it is due to an increase in retirements. The term “population” is defined by the BLS as the civilian non-institutional population over the age of 16. Thus, those in the military and in prison are not counted. However, as retirements rise, the number willing to work in the population group does fall. Still, we have serious doubts that this alone accounts for eight million jobs. Thus, there may be more slack available than the unemployment rate itself would suggest.
In addition, the level of involuntary part-time employment remains elevated.
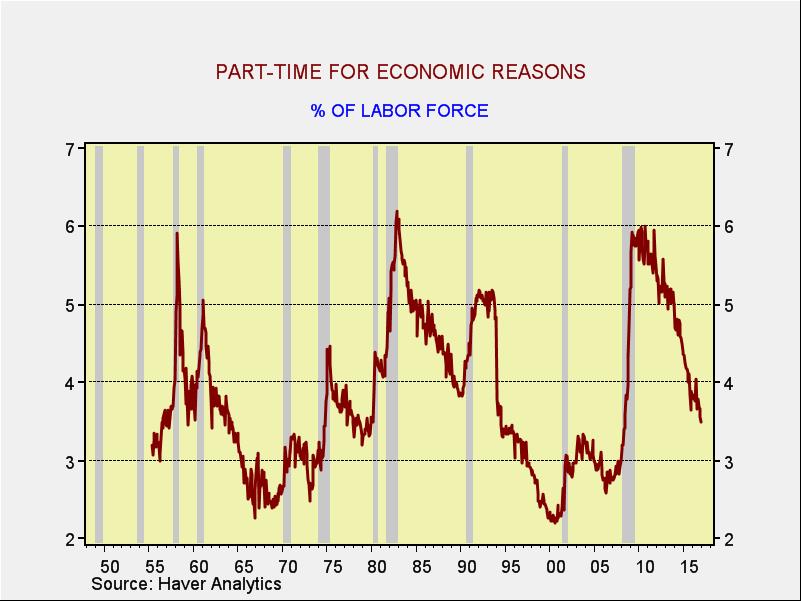
This chart shows the level of involuntary part-time employment as a percentage of the labor force. Although the number has been falling recently, it remains well above the troughs seen in the last two business cycles, which may suggest that firms could tap the part-time market for additional workers.
Finally, wages are remarkably low given the current unemployment rate.
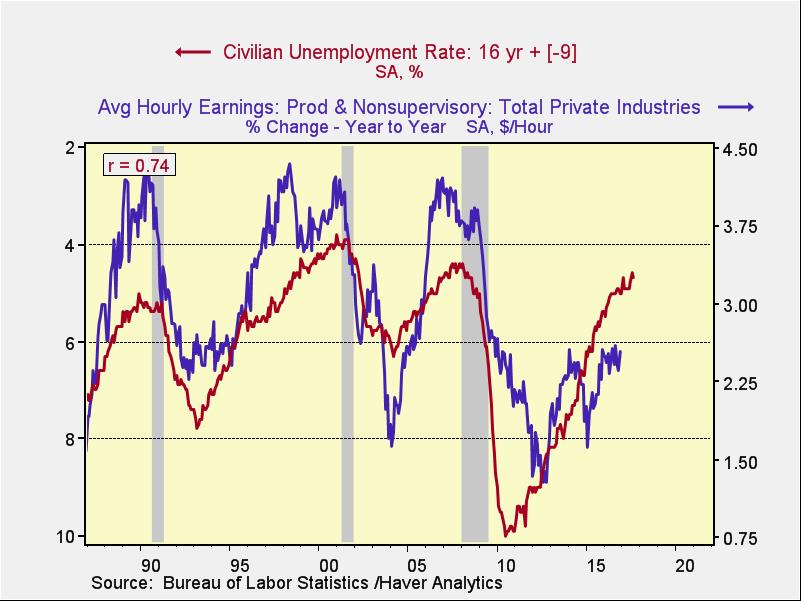
This chart looks at the unemployment rate relative to wage growth for non-supervisory workers. Note that on the graph, the scale for the unemployment rate is inverted and advanced nine months. In the past, when the unemployment rate has been this low, wage growth has been running a bit higher than 3.75% per year. It is currently around 2.5%. The lack of wage growth could suggest that there is enough “hidden unemployment” to keep wages suppressed.
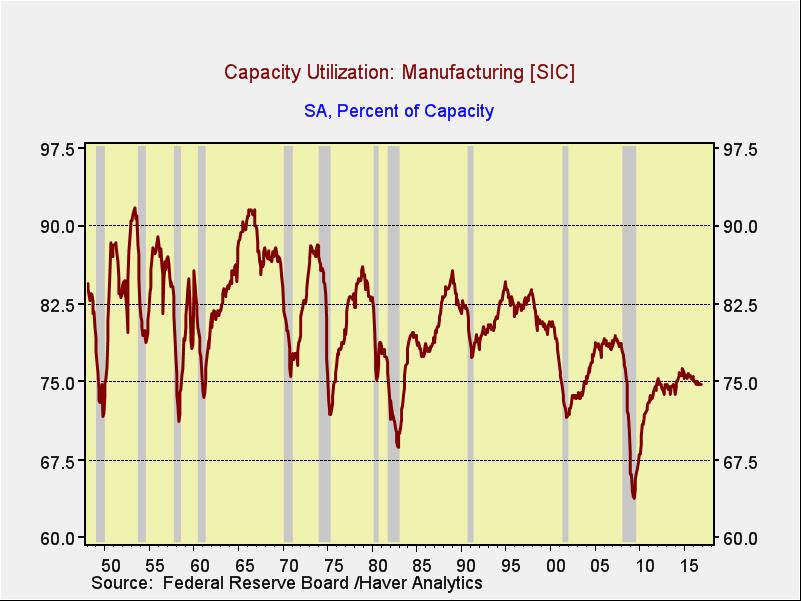
Finally, capacity utilization is consistent with available resources. Utilization in manufacturing is less than 75%. We do note the relationship between capacity utilization and inflation isn’t all that clear. One reason is that the economy is constantly competing with overseas capacity, which may be cheaper to utilize. This is where the president’s trade policy may have an impact, leading to both higher utilization here and rising price levels. Still, at present, it appears that the economy could absorb the strain from fiscal spending on infrastructure.
Of course, the other issue is the return on infrastructure investment. Any investment, either public or private, is measured on its return. Unfortunately, by its very nature, public investment doesn’t have a clear return otherwise the private sector would willingly provide it. In theory, roads could be completely privately funded and paid for by user fees. In a world of electronic tolling, one could even engage in congestion pricing and offer “sales” during slack road use periods. But some public investment simply can’t be priced; defense is a classic example as are some elements of public transportation. The issue of wise public investment is complicated. Many projects turn out to be less of a boost to the economy than planned. Still, the argument that the economy doesn’t need public infrastructure spending now because it isn’t needed is not necessarily true, as we outlined above.
____________________________________
[1] http://www.mcclatchydc.com/news/politics-government/white-house/article128492164.html