Asset Allocation Weekly (May 19, 2017)
by Asset Allocation Committee
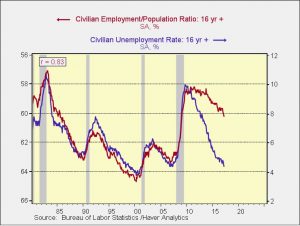
One of the significant “known/unknowns” is the true condition of the labor market. The below chart highlights the issue.
The blue line is the unemployment rate, while the red line is the employment/population ratio (scale inverted). From 1980 until 2010, these two series closely tracked each other. During the period since the last recession, the two have clearly diverged. The current unemployment rate is 4.4%; if the relationship from 1980 to 2010 had held constant, the unemployment rate would be approximately 7.5%.
For policymakers, the problem is determining which measure of the labor market best characterizes the degree of slack in the economy. If the employment/population ratio is correct, then ample slack exists and policymakers should keep policy accommodative. If the unemployment rate is the better measure, then labor markets are tight and the FOMC needs to be raising rates.
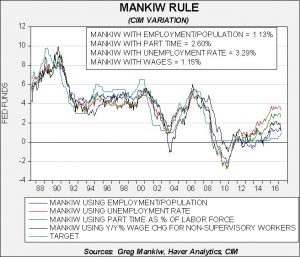
To determine the degree of accommodation, we use four variations of the Mankiw Rule. The Mankiw Rule models attempt to determine the neutral rate for fed funds, which is a rate that is neither accommodative nor stimulative. Mankiw’s model is a variation of the Taylor Rule. The latter measures the neutral rate using core CPI and the difference between GDP and potential GDP, which is an estimate of slack in the economy. Potential GDP cannot be directly observed, only estimated. To overcome this problem with potential GDP, Mankiw used the unemployment rate as a proxy for economic slack. We have created four versions of the rule, one that follows the original construction by using the unemployment rate as a measure of slack, a second that uses the employment/population ratio, a third using involuntary part-time workers as a percentage of the total labor force and a fourth using yearly wage growth for non-supervisory workers.
Using the unemployment rate, the neutral rate is now 3.29%. Using the employment/population ratio, the neutral rate is 1.13%. Using involuntary part-time employment, the neutral rate is 2.60%. Using wage growth for non-supervisory workers, the neutral rate is 1.15%. Note that for two of the variations, wage growth and the employment/population ratio, the FOMC is already near the neutral rate. The fact that policymakers appear driven to lift rates further suggests they believe that some other measure is a proper measure of slack.
Since the Great Financial Crisis, it has been unclear which measure of employment accurately characterizes the labor market. Because the Fed had been conducting very easy monetary policy, the debate was mostly academic; that isn’t the case anymore. If the most accurate measure is actually the employment/population ratio or wage growth, but the Fed thinks either the unemployment rate or involuntary part-time employment is the correct indicator of slack, then policymakers could run the risk of overtightening and potentially risking a recession.
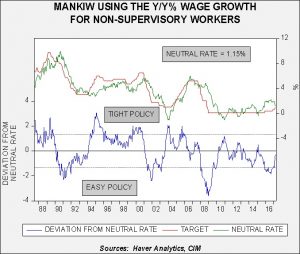
This chart shows the issue; this is the Mankiw model variation using wage growth. The lower line on the chart shows the deviation from the neutral rate as projected by the model. When the rate is below zero, policy is leaning toward accommodative. Note the parallel lines on the lower part of the chart; these lines measure a standard error on either side of the neutral rate. When the deviation is within the parallel lines, it suggests policy is mostly neutral. Thus, based on wage growth, we are close enough to neutral policy that the Fed could stand pat until either wage growth accelerates or core CPI rises.
Thus, the coming months will be key. If this model is the most accurate measure of slack then the Fed needs, at most, one more hike. Policy would be tight at a fed funds target of 2.40%, so there is some margin for error. Based on the dots chart, we would be at this level by the end of next year. Simply put, we could be approaching a period where monetary policy shifts to a headwind.
The path of monetary policy has been a key element in the asset allocation committee’s analysis of the economy and markets. We are moving into a more critical phase where the potential for a policy error is rising. By year’s end, we could have a fed funds rate that would be modestly higher than neutral using at least two of the four variations of the Mankiw Rule model. That would increase the potential for a recession which we would expect to have a negative impact on equity markets. Thus, this is an issue we will be closely monitoring into the second half of 2017.


