Asset Allocation Weekly (March 23, 2018)
by Asset Allocation Committee
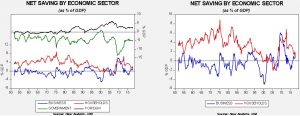
Last week, the Federal Reserve published its Financial Accounts of the United States report, formerly known as the Flow of Funds report. The report is a storehouse of important financial information. In this most recent report, a few things emerged that raised concerns. The first issue is net saving. Net saving is a macroeconomic identity; for every sector that saves, some other sector must dissave so the four major sectors of the economy—business, households, government and foreign—balance to zero each quarter.
The chart on the left shows the four major sectors. Household saving is income less consumption, business saving is revenue less investment, government saving is taxes less spending and the foreign sector is the inverse of the current account. All the data are scaled by GDP. Business saving vacillates between saving and dissaving; when businesses dissave, it means their investment exceeds their income and they are using the capital markets for funding. This chart shows important long-term trends in the economy; household saving peaked in the mid-1970s and fell steadily into the Great Financial Crisis, with dissaving in 2004-05. Foreign saving (a larger trade deficit) became common during the 1980s and has remained elevated ever since. To accommodate the foreign saving, either government or the private sector has lowered saving rates.
The chart on the right shows a rather disturbing development—a sharp drop in household saving and a commensurate rise in business saving. It isn’t clear what exactly caused households to lower their saving, but it could be that households were anticipating the tax cut and increased their spending. It’s also not clear why businesses boosted saving. In general, rising business saving comes at the expense of lower investment. One quarter’s data doesn’t make a trend, but if this pattern persists it would suggest lower future household consumption (eventually, the lack of saving undermines spending) and a decline in investment. Given that government dissaving is poised to rise and the president wants to impede trade, the domestic private sector would be called upon to fund the public deficit. That development would likely lead to slower growth.
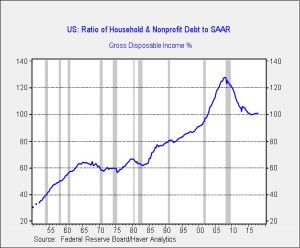
The second issue shown in the recent report is that household deleveraging appears to have ended in Q4.
This chart shows household debt as a percentage of after-tax income. Although this ratio stabilized in 2016, it rose this quarter to its highest level since Q4 2014. Although not a major increase, the trend is disturbing because we doubt households have much additional debt capacity.
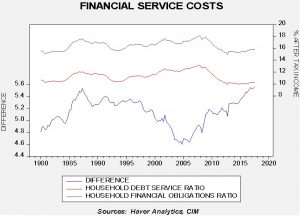
The two upper lines in this chart show the household financial obligations ratio, which includes debt payments plus auto leasing payments, rent, property taxes and homeowners insurance relative to after-tax income, and the household debt service ratio, which is just debt service (mortgage and consumer credit) relative to after-tax income. The lower line on the chart shows the difference between the two ratios. Both ratios have been rising but the financial obligations ratio has been increasing faster, likely reflecting higher rent payments. The difference, which has distributional effects, is now at record levels. The other concern is that both ratios are rising at the same time as tightening monetary policy. Rising interest rates coupled with higher levels of debt will likely mean rising debt obligations, which will eventually weaken consumption.
While our analysis of the economic data still suggests a recession won’t happen this year, the trends in some series do suggest the cycle is aging and the potential is rising for a slowdown in 2019. We continue to monitor the data closely as this year unfolds.


