

Asset Allocation Weekly (June 22, 2018)
by Asset Allocation Committee
Cycle studies are common in analyzing markets. Such studies can be quite useful in some markets that are affected by seasonal factors, such as commodities. We all know it gets cold in the winter and rains in the spring, and measuring the timing of when market participants discount these events can offer insights into market behavior. In general, the more regular and reliable the factors are that cause the cyclicality, the more trustworthy the analysis. Seasonal cycles tend to be consistent and thus are heavily used in commodity analysis. Of course, once a pattern has been discovered, traders attempt to position in front of the expected price cycle. Commodity analysts will note that price patterns still work but they often start sooner.
Human cycles tend to be much less reliable. Usually, these cycles occur because of the structure of regulation; one example is tax selling, which sometimes weakens equity prices in late Q3. It doesn’t always work because (a) tax laws change, or (b) sometimes investors don’t have a lot of losses to “harvest.” Market research is full of examples that “used to work.” Often, once analysts notice a cycle, there is a temptation to publish it, in part for reputational enhancement. However, publishing makes the cycle better known and will often render it useless.
Elections in democracies create cycles with some degree of regularity. In the U.S., elections are not called, as is common in a parliamentary system, but occur on schedule. Policymakers are aware of elections and want to manipulate the economy in ways that improve their chances of re-election. For example, presidents have an incentive to implement painful policies during the first two years of their term with the hopes of an economic rebound in the last two years. That pattern usually means the mid-terms hurt the party of the president. At the same time, a president is at the peak of his political capital at inauguration. That capital erodes with time and thus if one is going to do something “big” the best chance is in the first 18 months of the presidency. By around May of the second year, the initial political capital is mostly exhausted, meaning little new accomplishments are enacted. In the third year, the president tries to implement policies that support growth to increase the chances of re-election and Congress often participates for the same reason.
To measure these effects, we created a database using the Friday close of the S&P 500, beginning in 1928. We indexed each four-year cycle at the beginning of the election year. Thus, we ended up with 22 cycles, excluding the current one, which began in 2016. Here is what the patterns indicate:
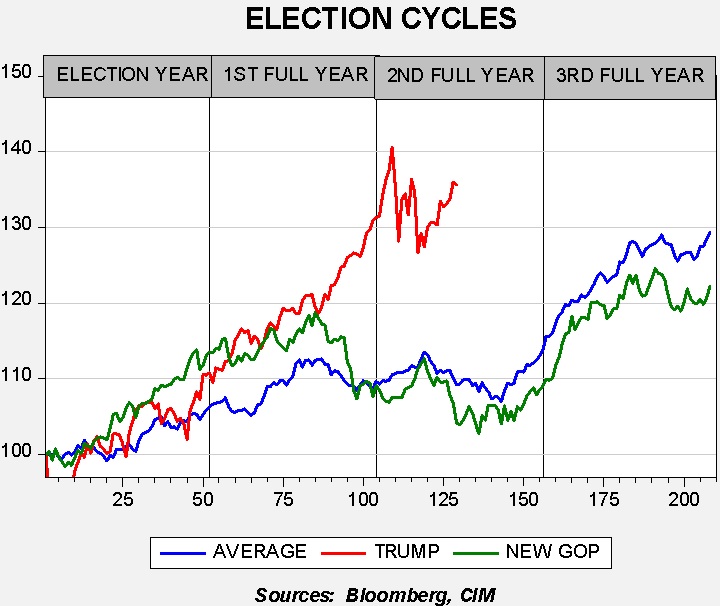
The blue line on the chart shows the long-term average of all cycles. The green line shows the pattern for a newly elected Republican president and the red line shows the current administration. The pattern suggests that equities tend to favor the GOP, at least for the first 18 months of the cycle. The two average lines converge by Q4 of the first full year. The second full year tends to be the most disappointing for equities, on average, although a strong rally from the mid-terms into the year prior to the next election usually develops.
President Trump’s first term was closely tracking an average new Republican president until it became clear that the tax law changes were going to pass. This led equities to rise sharply. However, in the aftermath of the tax changes, equities have moved sideways, which is consistent with the second full-year pattern but, in this particular case, from a much higher level. The usual pattern could be indicating one of two outcomes. First, equities will likely struggle into Q4 and then stage their usual third-year rally. Or, second, we have already had the “Trump bull market” and the rest of his first term will be “churn,” leaving us about where we would be without the tax-driven lift in markets.
Although either scenario is possible, we tend to expect the first is more likely. There is little evidence that the economy is near recession, which is the primary cause of cyclical bear markets. While earnings growth will likely slow next year, the tax law changes should keep the level of earnings elevated. In fact, the recent weak performance in equities is due to multiple contraction, most likely due to fears surrounding trade conflicts. If the administration can resolve these issues without serious incident, it would bolster the case for a rally next year. On the other hand, if trade issues escalate, the second scenario is more likely, which would be no major pullback in equities but a long-term sideways market.
Clearly, other factors will play a role and these cyclical studies are not definitive. Nevertheless, they do offer some insight into the normal policy cycle, which the current presidency was tracking until November. For now, we consider a trade war the most near-term serious threat to equities.