

Asset Allocation Weekly (February 9, 2018)
by Asset Allocation Committee
The continued rise in long-term interest rates is clearly grabbing the attention of financial markets. Stronger than expected wage growth was the proximate cause of the recent lift in yields. Although overall wages rose 2.9%, wages for production and non-supervisory workers grew only 2.4%. Still, it is clear that fears of inflation stemming from an accelerating economy and concerns about monetary policy tightening are leading to rising interest rates.
Here is our updated 10-year T-note model.
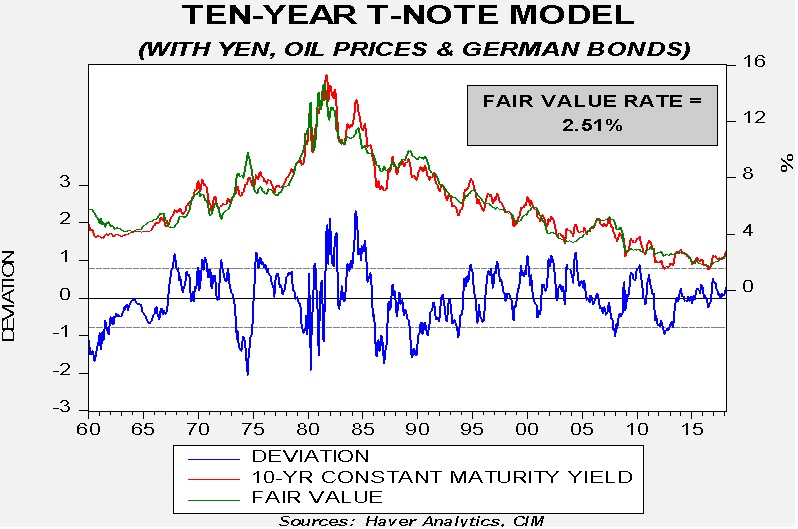
The model’s core variables are fed funds and the 15-year moving average of inflation, which we use as a proxy for inflation expectations. The other three variables are the yen, oil prices and German long-duration sovereign yields. The current yield on the 10-year T-note, which is in the 2.80% range, is running above fair value. The standard error for this model, shown on the lower part of the graph as the parallel lines running along the midpoint of the standard error, is ±70 bps. Thus, reaching a level that would signal excessively high yields would be 3.20%.
Complicating this case is the fact that the FOMC is expected to raise rates at least three times this year, and perhaps four, German yields are rising and oil prices have increased as well. To project the potential lift in yields, we made some projections. Assuming the FOMC moves the upper end of the target rate to 2.25%, with nothing else changing, fair value for the 10-year T-note will reach 2.825%. The recent lift in 10-year T-note yields appears to be mostly discounting tighter monetary policy. If oil prices reach $75 per barrel, the fair value yield would hit 2.90%, and if German yields rise to 1.00%, we would see 2.95%. This suggests to us that a reasonable projection of variables likely takes us to a 3.00% 10-year T-note in the coming months. In other words, it appears the 10-year T-note yield is mostly about discounting tighter monetary policy.
One other factor worth mentioning is that bond and stock prices have been positively correlated recently. Under these circumstances, the effectiveness of bonds as a portfolio diversification tool is reduced.
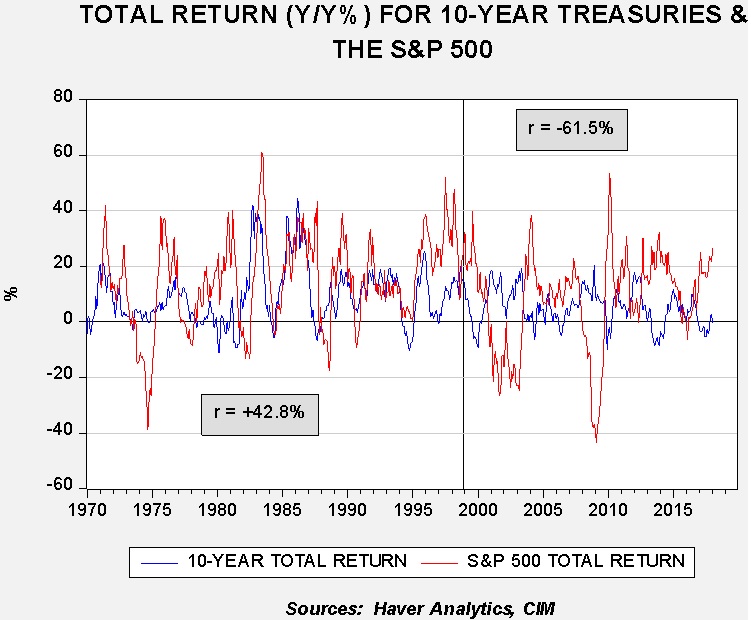
It’s interesting that the returns were positively correlated from 1970 to 1998. What caused the reversal? Most likely it’s a function of the steady decline in interest rates from their high peak in the early 1980s to normal levels by the late 1990s. In other words, falling yields were the norm during that two-decade period and, as rates fell, it supported rising P/E multiples. After rates normalized by the end of the 1990s, the ordinary inverse relationship between equities and bond prices emerged. Although the short-term price action between bonds and equities is a concern, we doubt it will be maintained. Since the shift in the correlation occurred in the late 1990s, we have seen two periods when the one-year rolling correlation became positive, 2007 and 2015. Neither event lasted very long nor did it undermine the longer term diversification that longer duration bonds offered. We suspect the current positively correlated event is due to an overbought correction in equities and a bond market discounting tighter monetary policy (as noted above). Thus, we view this as a temporary event.