

Asset Allocation Weekly (August 11, 2017)
by Asset Allocation Committee
Although measuring “malaise” is more art than science, overall feelings of wellbeing or the lack thereof affect markets, politics, etc. One less common way to measure this is the ratio between discretionary spending compared to overall spending. Discretionary spending is defined as total spending less what is spent on food, clothing, energy and housing. In other words, if a household is able to spend more on other items besides these goods, one would expect “happier” people. Spending more on necessities, on the other hand, can make households feel as if they “can’t get ahead.”
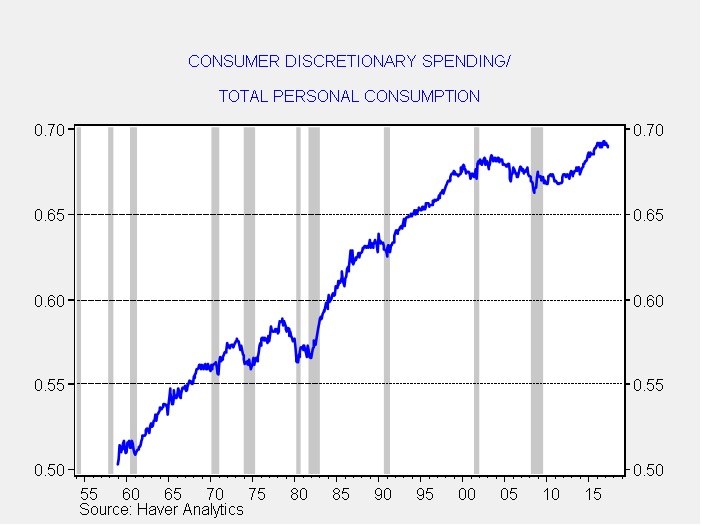
This chart shows the ratio of consumer discretionary spending to total personal consumption. A higher ratio means that households are spending more on discretionary items and less on food, clothing, gas, heat and rent. Although the ratio has generally increased since the late 1950s, there have been two periods when the pace of improvement slowed, in the 1970s and since 2000.
To better analyze the behavior of this ratio, we regressed the ratio against a time trend.
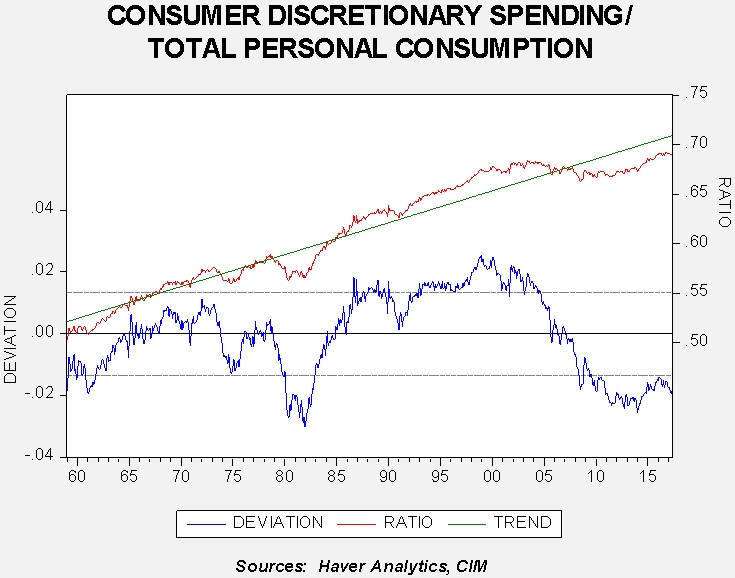
There have been four periods when this ratio was significantly below trend. The first was in the early 1960s. John F. Kennedy’s presidential campaign promised to get America moving again after the somnolent 1950s. The second occurred during the deep 1973-75 recession, which coincided with the first energy crisis. The third occurred during the late 1970s into the early 1980s; this period featured a “double dip” recession and another energy crisis. The 1970s also had major political problems, including the Nixon resignation and the difficult presidency of Jimmy Carter.
The most recent event has been the longest. The major recession of 2007-09 coupled with a slow recovery and stagnant income growth has led to a period where necessities are taking up a bigger share of spending relative to trend. It coincides with deep political divisions and a fear among many Americans that stagnation is never-ending.
To some extent, this is an imperfect measure of sentiment. After all, the trend will eventually reach 100%, which would mean that spending on the four necessities would need to fall to zero (either we stop eating, wearing clothes, driving and living in homes or apartments) or the cost of these goods would approach zero. Neither scenario is likely. Still, the fact that spending on necessities is higher than trend relative to other spending has proven, historically, to signal social and political problems. As one who lived through President Carter’s “malaise” speech, the feeling in the late 1970s was rather bleak. Ronald Reagan’s optimism was key to lifting the country out of this funk. The fall in inflation that allowed households to spend less on necessities did the rest.
So far, this period of below-trend spending on discretionary goods has not adversely affected financial markets. However, it is clearly having an impact on the current political situation and, at some point, it could affect market confidence. We monitor these conditions closely and are somewhat heartened by the recent improvement in this ratio. However, this time around, falling prices for energy and food probably won’t be enough to raise this ratio. Rising wages for the bulk of American households is probably the only way to lift this ratio back to trend.