

Daily Comment (September 13, 2018)
by Bill O’Grady and Thomas Wash
[Posted: 9:30 AM EDT] Happy Thursday! Here is what we are watching today:
Trade talks back on: Equities are elevated this morning after it was revealed that the U.S. and China are open to restarting trade negotiations. This breakthrough came on the heels of President Trump’s threat to impose tariffs on an additional $200 billion of Chinese goods. Recently, President Trump has received flak from businesses about the escalating trade conflict. Last week, Apple (AAPL, $221.07) wrote a letter to the president stating that tariffs would force the company to raise its prices; the president shrugged off the criticism and said the company should relocate its facilities back to the U.S. Although we do not expect a deal to be made prior to the midterm elections, this development does suggest that the two sides have softened their stances.
Turkish Central Bank: This morning, Turkey’s central bank raised its main interest rate from 17.75% to 24.00% in order to combat rising inflation; as a result, the lira strengthened against the dollar. Rising inflation and high amounts of foreign currency debt have called into question Turkey’s solvency. Although Turkey’s economic crisis is far from over, the central bank’s decision did restore some degree of confidence in the lira.
Beige Book and the Fed: Reports on growth were surprisingly mixed. The St. Louis, Kansas City and Philadelphia districts reported below-trend growth, while the Dallas district indicated above-trend growth. Residential real estate was mixed, with the New York district reporting a sharp decline in New York City real estate activity. The Federal tax law changes were cited as a reason for the weakness. All the districts reported tight labor market conditions. The Minneapolis district reported that anecdotal comments from businesses said it was difficult to attract recruits with hourly wages of less than $15 per hour. Half of the districts reported that labor shortages were constraining economic activity. There were also reports of signing bonuses, increased benefits and training as a way to attract workers. Price pressures remain somewhat elevated, but not at levels that seem to be a significant problem.
A rate hike at the September 26th meeting is a near certainty. More importantly, we are seeing the financial markets discount a rising probability of another increase at the December 19th meeting.
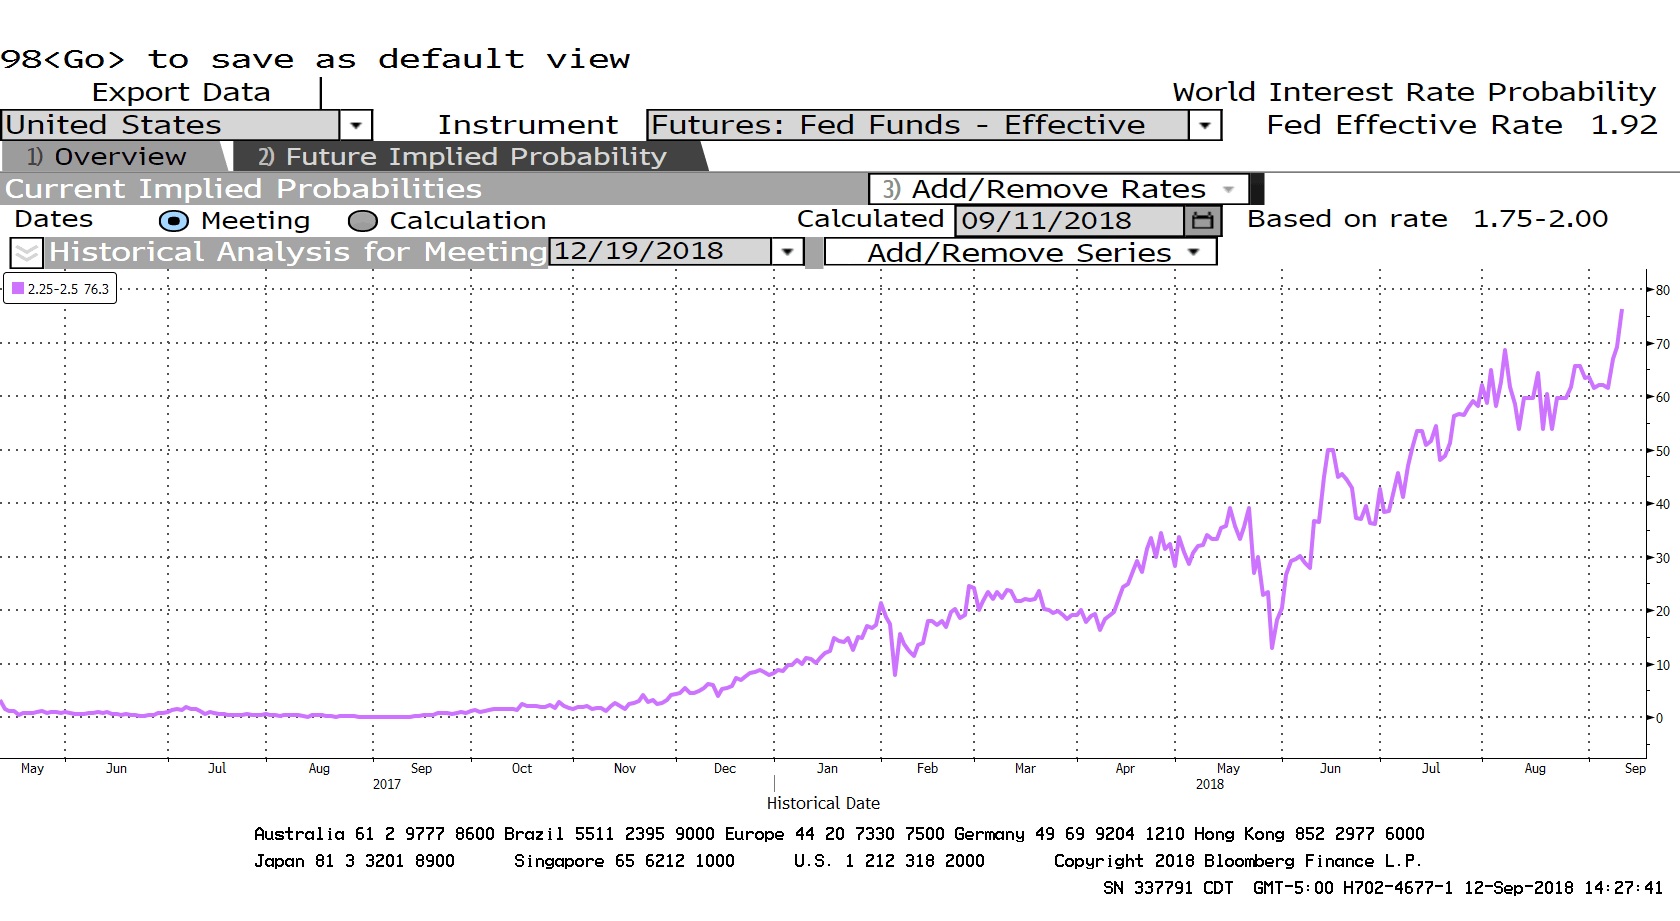
The current probability of a 25 bps hike at the December meeting, taking the target’s upper limit to 2.50%, is 76.3%.
The three-month implied LIBOR rate, two-years deferred, from the Eurodollar futures market has ticked higher, reaching 3.10%. Recent history has shown that the FOMC tends to end its tightening cycle when this implied rate and the target rate inverts.
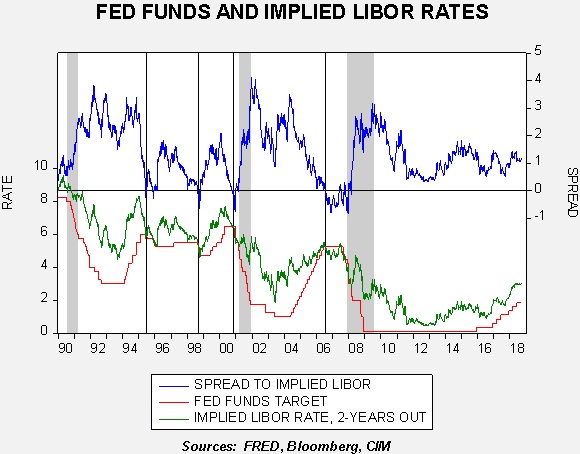
This rise in the implied LIBOR rate suggests a terminal rate closer to 3.25%. That would mean two more hikes this year and three next year.
Real family income: The Census Bureau released its annual report on median household and family income. We prefer the latter number because it has a longer track record. We have a new record at $75,938 in 2016 dollars. Household income also made a new record on the same basis at $61,375.
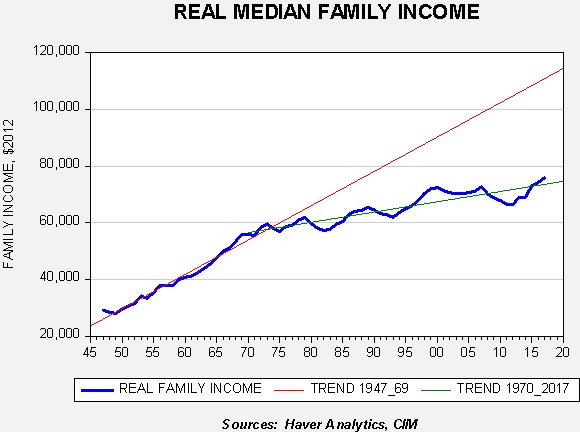
This chart shows real family income data; we have regressed time trends through the numbers, one trend line for the period 1947-69 and the other from 1970 to the present. The compound annual growth rate in median real family income in the 1947-69 period was 3.3%; in the latter period it’s a mere 0.5%. If the country had stayed on the earlier trend line, real median family incomes would be $110,910. This trend change goes a long way in explaining the political and social unrest we are seeing in the country.
Energy recap: U.S. crude oil inventories fell 5.3 mb compared to market expectations of a 2.3 mb draw.
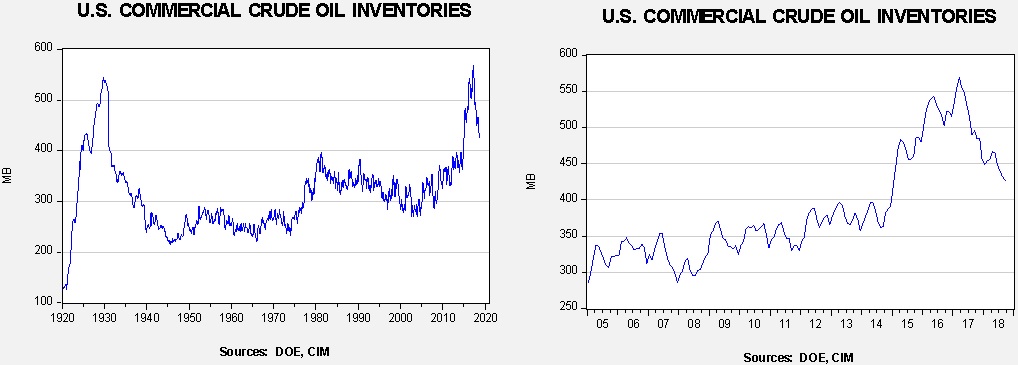
This chart shows current crude oil inventories, both over the long term and the last decade. We have added the estimated level of lease stocks to maintain the consistency of the data. As the chart shows, inventories remain historically high but have declined significantly since March 2017. We would consider the overhang closed if stocks fall under 400 mb. Refinery utilization rose to 97.6%, up 1.0% from last week. Oil production dipped to 10.9 mbpd. Imports fell and exports increased; between falling imports, lower production, high refinery runs and higher exports, oil inventories continue to slide.
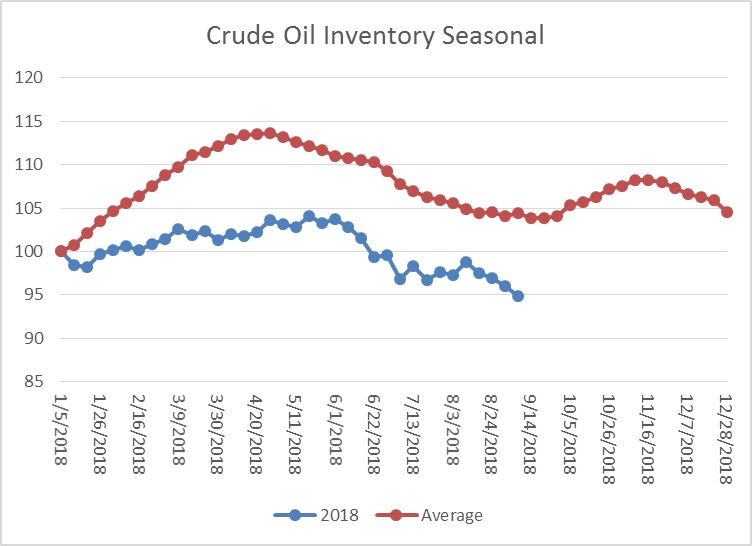
As the seasonal chart below shows, inventories are near the end of their seasonal withdrawal period. This week’s decline was rather high. As we discussed in the recent Quarterly Energy Comment,[1] oil exports may change the seasonal pattern and lead to a less cyclical stock situation.
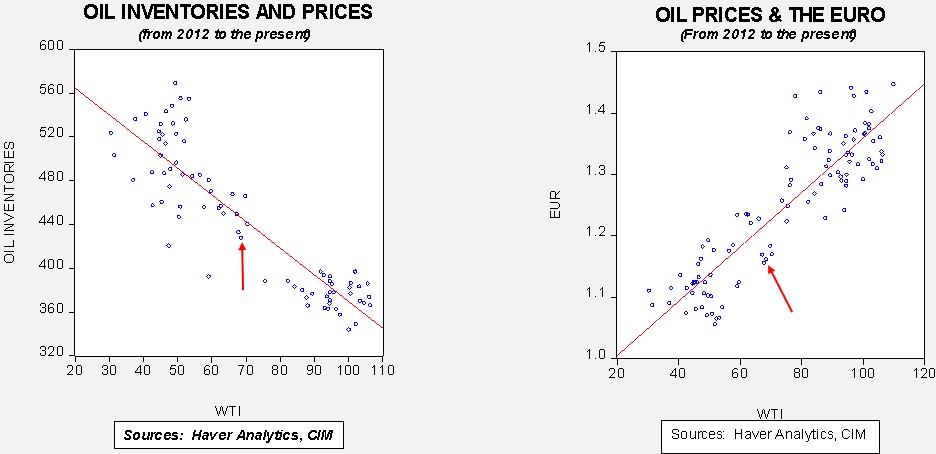
Based on inventories alone, oil prices are below fair value price at $75.27. Meanwhile, the EUR/WTI model generates a fair value of $59.51. Together (which is a more sound methodology), fair value is $64.78, meaning that current prices are well above fair value. However, the most bearish factor for oil is dollar strength. It will be difficult for oil prices to move higher without some reversal in the greenback. Oil prices have been bolstered by concerns surrounding Hurricane Florence and the expected increase in product demand. That issue should dissipate in the next few days.
[1] See Quarterly Energy Comment, 9/7/2018