

Daily Comment (November 16, 2017)
by Bill O’Grady and Thomas Wash
[Posted: 9:30 AM EST] After a few days of risk concerns, equity markets are “in the green” this morning. The dollar and Treasury yields are higher. Here is what we are watching this morning:
The tax bill: The House is expected to pass its version of the tax bill today. Although we expect a close vote, it will almost certainly pass; if Speaker Ryan brings the bill to the floor without sufficient votes, he should be relieved of his duties. The problem is the Senate. Ron Johnson (R-WI) has come out against the bill in its present form and the clause to end the ACA insurance mandate has brought Susan Collins (R-ME) into the possible “no” column. Jeff Flake (R-AZ) and Bob Corker (R-TN) have misgivings about the expected deficits from the bill…and both are virtually immune to pressure from lobbyists because they aren’t running for re-election. The margin now in the Senate is razor thin and it isn’t obvious that the House could abide by the Senate version. Getting tax changes done at all remains a long shot in our view and getting them done by year’s end looks increasingly unlikely.
Don’t forget the continuing resolution: The debt ceiling is a gift to the political opposition in the U.S. political system. In reality, the debt ceiling should be nothing more than a reminder to Congress about its spending. However, not raising it means the government isn’t going to pay for things it has already spent money on. There is a legitimate debate on spending and the deficit; shutting down the government over the debt ceiling is not a legitimate way of resolving it. In September, when the debt ceiling issue last loomed, the series of hurricanes made cutting spending to avoid more debt politically impossible for both parties. In addition, President Trump was making overtures to “Chuck and Nancy,” which made it easy for the Democrats to agree to an extension. However, Washington is knee-deep in tax proposals that the Democrats really dislike (e.g., ending the state and local tax deduction, or SALT, which disproportionately harms “blue” states), and the debt ceiling will give Chuck and Nancy leverage. History shows that equity markets don’t become overly concerned over these issues as long as there aren’t real worries about default.
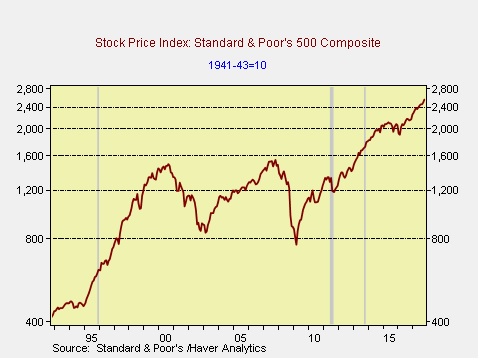
Debt ceiling events are shown in gray. The only one that was significant was in 2011, when fears arose that the U.S. may actually default and was downgraded to AA by Standard & Poor’s. Although we don’t expect anything like 2011, we are worried that the GOP congressional leadership is so focused on the tax bills that it lacks the available “bandwidth” to deal with this issue. Thus, a week or two of brinkmanship could weigh on sentiment.
A note about earnings: At the end of this report we include our weekly P/E chart. This week, we add the actual Q3 S&P earnings data from Standard & Poor’s (actually, from Haver Analytics, which estimates the final number when over 90% of firms report). As has been the case for much of this recovery, the estimates of S&P operating earnings from Thomson-Reuters are higher than those from Standard & Poor’s. We view the latter as the official data but the former owns I/B/E/S, the premier source for future earnings estimates, and thus it is the preferred number in the media. We use the Standard & Poor’s number for most of the index’s earnings history because it allows us to show a chart dating back to the 1870s (see the end of this report). In our P/E calculations, we usually use two actual earnings numbers from Standard & Poor’s and two estimates from Thomson-Reuters; however, when we have sufficient reporting we then shift to three actual Standard & Poor’s numbers and one Thomson-Reuters. When this happens, there are discrete jumps in the current reporting quarter (see footnote in the P/E section for more clarification). After New Year’s, when we return to two actual, two estimates, there will be a discrete rise in the P/E as well.
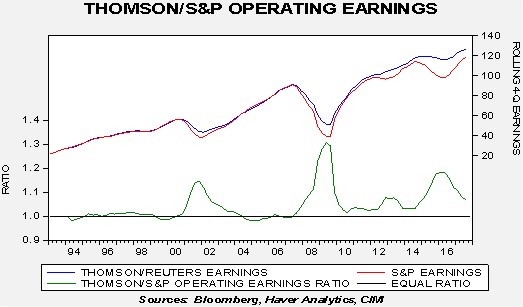
This chart shows a history of the two series on a four-quarter rolling basis. During the two recessions/bear markets, the ratio tended to widen significantly as the Standard & Poor’s number fell much faster than Thomson-Reuters. But, until this bull market, the two series tended to closely match each other. We note the divergence widened when oil prices fell in 2014 and narrowed as oil prices recovered. Which is the better number? We are agnostic on this issue because we can address the divergence with various statistical tools, but we wanted to offer more detail on why the P/E rose this week.
Energy recap: U.S. crude oil inventories rose 1.9 mb compared to market expectations of a 3.2 mb draw.
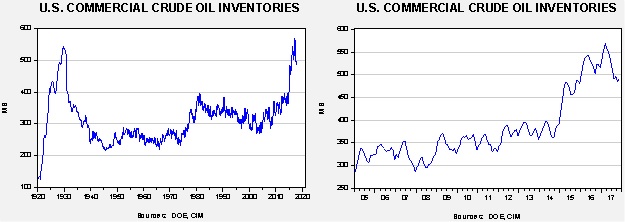
This chart shows current crude oil inventories, both over the long term and the last decade. We have added the estimated level of lease stocks to maintain the consistency of the data. The DOE has revised its data (an exercise it does periodically) and inventories are falling faster than earlier estimated. As the chart shows, inventories remain historically high but have declined significantly this year. We also note the SPR fell by 0.7 mb, meaning the net build was 1.2 mb.
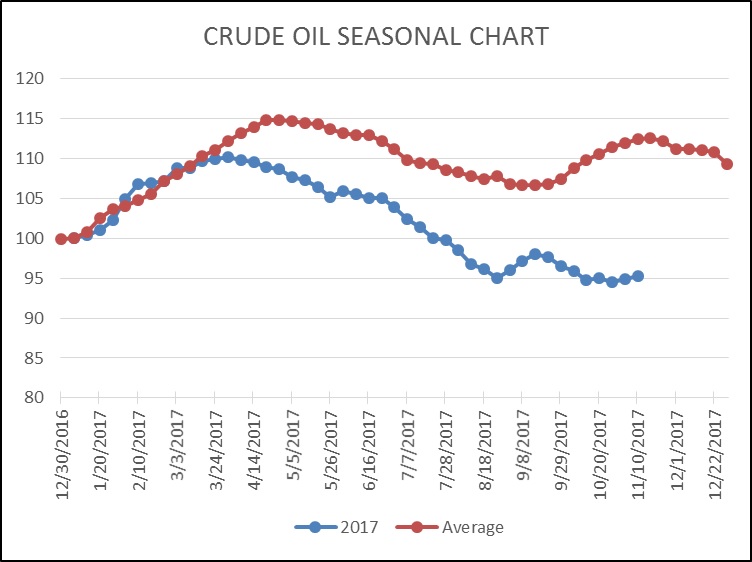
As the seasonal chart below shows, inventories rose modestly this week. It appears that we are “skipping” the usual autumn inventory rebuild period. Usually, inventories would peak next week. After that, stockpiles would decline into year’s end and then start their largest build from early January into early April.
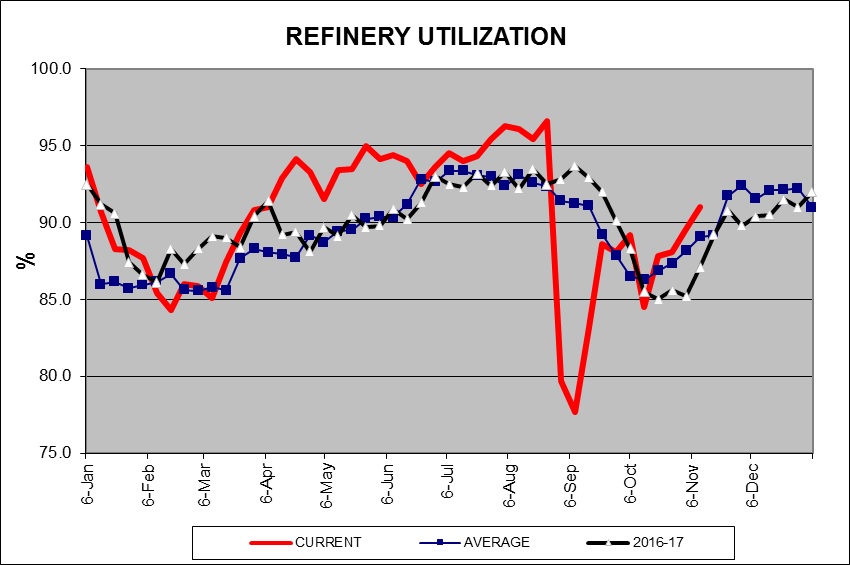
Refinery operations continued to rise last week, in line with seasonal norms. We expect them to peak very soon.
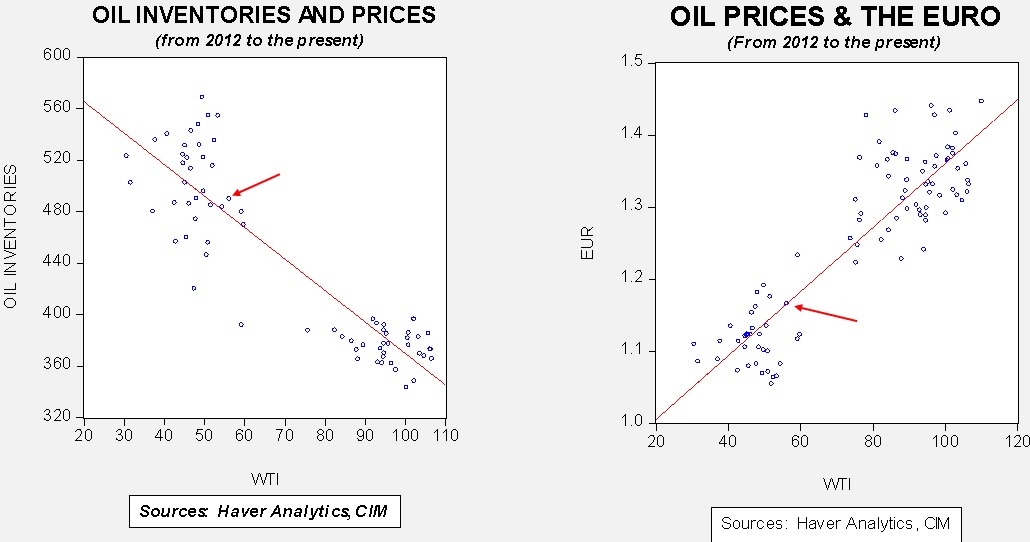
Based on inventories alone, oil prices are undervalued with the fair value price of $55.00. Meanwhile, the EUR/WTI model generates a fair value of $60.68. Together (which is a more sound methodology), fair value is $58.37, meaning that current prices have fallen under fair value. OPEC meets at the end of the month and there are worries that Russia won’t extend the current output restrictions as much as the Saudis would prefer. At the same time, recent events in the Middle East increase the odds of supply concerns. Overall, oil prices are within normal ranges of current fundamentals but we are generally bullish toward crude oil at this time.