

Daily Comment (March 30, 2017)
by Bill O’Grady, Kaisa Stucke, and Thomas Wash
[Posted: 9:30 AM EDT] Markets are very quiet this morning. We are seeing the dollar lift in part due to hawkish comments from Fed officials yesterday. For example, Boston FRB President Rosengren called for three more hikes this year; we rate Rosengren as a moderate so his hawkish stance is notable. However, he isn’t a voter this year and we don’t expect the committee to lean against Chair Yellen, who seems content with two more increases. Still, this hawkish talk coupled with soft German inflation data is helping the dollar this morning.
A WSJ editorial is critical of President Trump’s immigration policy, suggesting it is causing shortages of labor and lifting wages. Given that this is one of his goals, we doubt the president will be too concerned with the WSJ’s worry. Still, if labor shortages are developing, we should be seeing it in the data. Since the editorial specifically mentioned construction, we decided to take a look at the numbers.
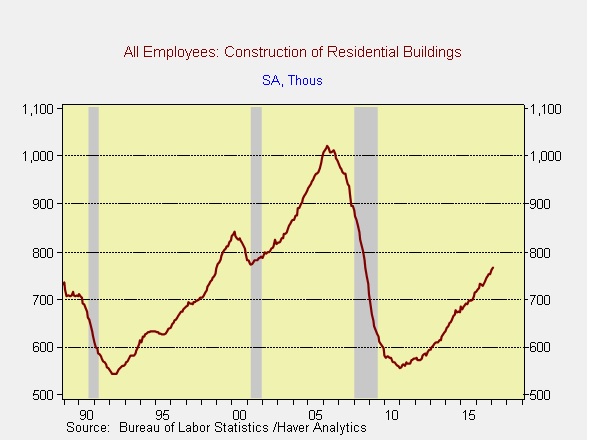
Residential construction jobs represent 766.9k jobs in the U.S., about 0.6% of total private sector jobs. That number is up 37.7% from the trough in January 2011. Jobs in this category grew 6.5% in February from the previous year. Wage growth is up 3.4% compared to 2.5% for private sector jobs in general.
What is interesting in the data is that there appears to be about a three-year lag between construction wage growth relative to overall private sector wage growth and housing starts.
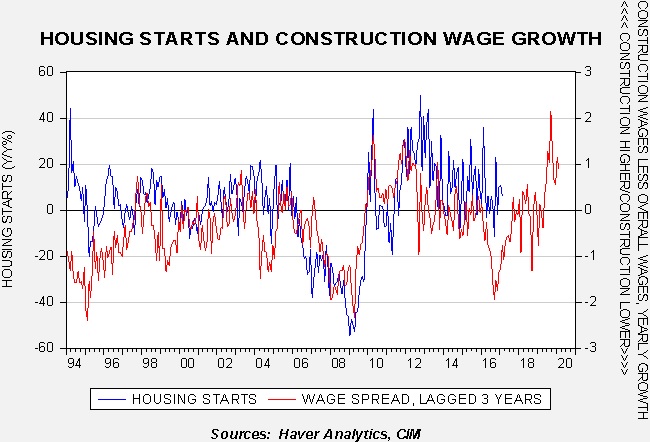
When wages paid to construction workers decline relative to other workers, housing starts decline with a three-year lag. We can’t determine the direction of causality; do starts fall because firms can’t find workers because they are finding better jobs elsewhere, or are relative wages falling because construction activity is soft? Because the relative wage data seems to lead starts, it suggests that relative wage growth drives starts. The current lack of workers that construction firms are anecdotally confirming is probably because three years ago construction wages lagged relative to other professions. The current rise is necessary to lure these workers out of those industries (or across the border, which is more difficult now). The data suggests that the process takes about three years, which makes some sense. If a worker had been in construction, lost his job in the downturn and has found other employment, luring him back to construction will take money and time. In other words, construction firms will need to offer higher wages for a period of time before workers will be willing to return. The data suggests that there could be some weakness in starts before picking up in late 2018 or early 2019. We do want to caution that the wage spread is not a strong determinant of starts—it is only a supply variable and demand variables, like housing affordability and the availability of mortgages, matter more. The bottom line is that we would expect tight labor conditions to persist in construction into next year as long as a recession is avoided.
U.S. crude oil inventories rose 0.9 mb compared to market expectations of a 1.4 mb build.
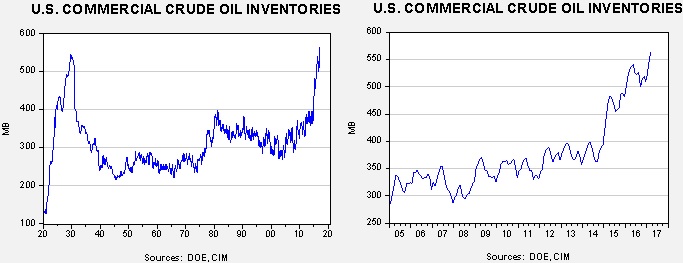
This chart shows current crude oil inventories, both over the long term and the last decade. We have added the estimated level of lease stocks to maintain the consistency of the data. As the chart below shows, inventories remain elevated.
As the seasonal chart below shows, inventories usually increase into April before rising refinery operations for the summer driving season lower stockpiles. This week’s rise puts us further below normal. If we begin to see inventory accumulation slow below normal it would be supportive for prices. Although our models are still quite bearish, slowing inventory builds could portend faster withdrawals later this year and support oil prices.
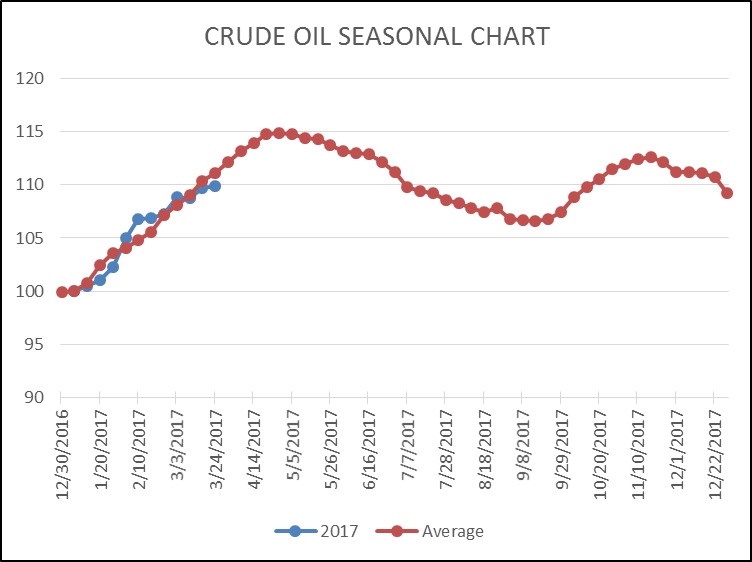
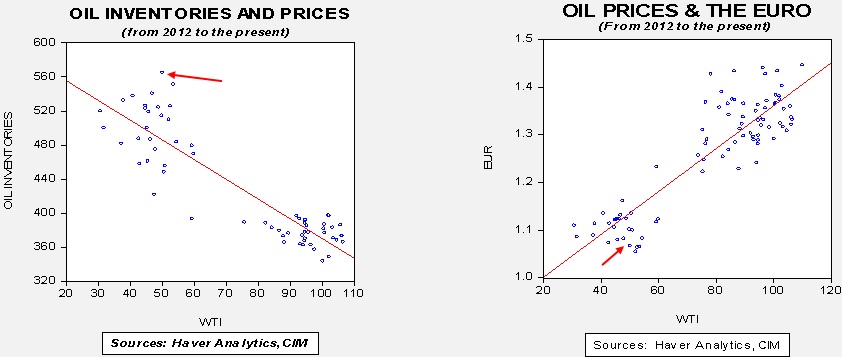
Based on inventories alone, oil prices are overvalued with the fair value price of $27.32. Meanwhile, the EUR/WTI model generates a fair value of $40.14. Together (which is a more sound methodology), fair value is $35.14, meaning that current prices are well above fair value. The data does show that the bullish case for oil mostly rests on a weaker dollar. If the dollar continues to soften, oil may be able to overcome the inventory overhang which should be approaching its seasonal peak.
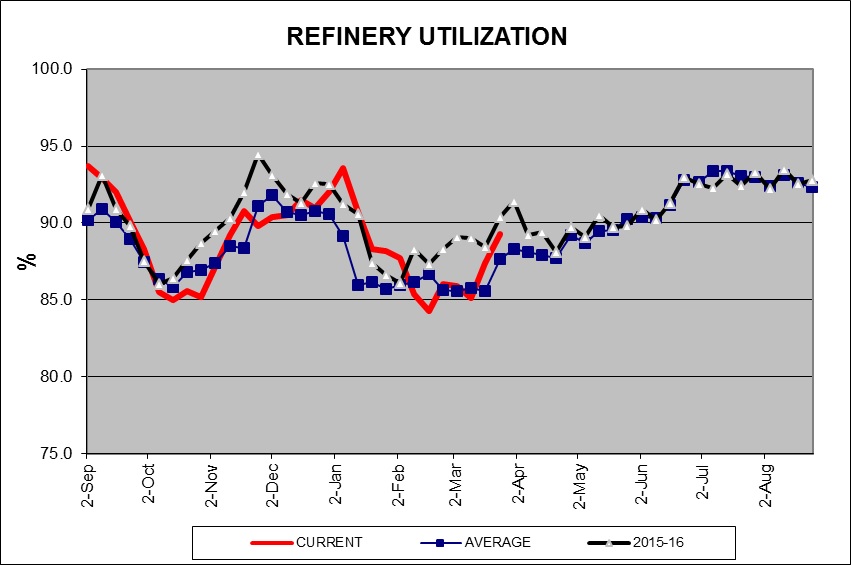
One of the bullish factors we are seeing is a pickup in refinery utilization. History suggests that we will see this number flatten into early May. If that fails to occur, the fundamentals for oil will improve.