

Daily Comment (December 15, 2016)
by Bill O’Grady, Kaisa Stucke, and Thomas Wash
[Posted: 9:30 AM EST] The Fed gave us a modest hawkish surprise, calling for three rate hikes in 2017 rather than two. That was taken as bearish by the financial markets yesterday with Treasury yields rising, equities declining and the dollar rising. U.S. equities are mostly flat this morning, but the dollar is sharply higher and Treasury yields are continuing to rise.
Here is the dots plot from September.
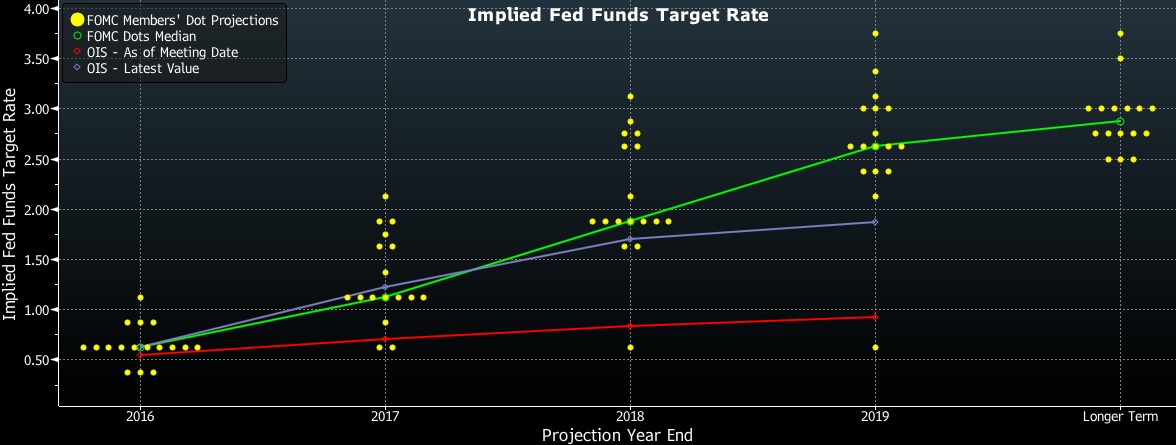
Note the purple line, which is the LIBOR-OIS curve from yesterday. It has jumped from where it was on the meeting date in September, shown by the red line.
Now, the current dots plot.
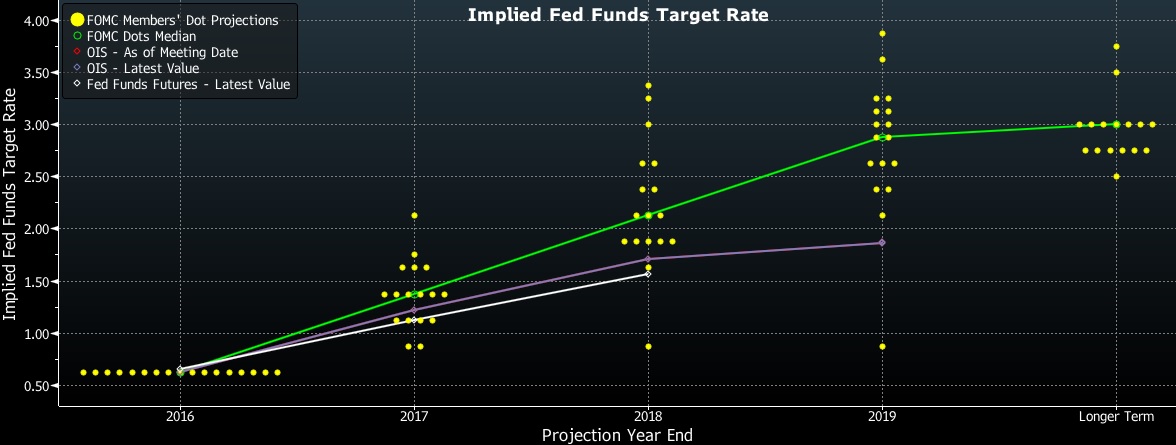
For 2017, the median forecast is currently 1.375%, up from 1.125% in September. For 2018, the median is up to 2.125% from 1.875%. Two participants see no change next year but one of those is probably St. Louis FRB President Bullard, who has decided not to participate in the dots procedure. Although the market expectations continue to lag, we did see the LIBOR-OIS rate rise to 1.25% from 0.875% in September.
This can be seen in the deferred Eurodollar futures.
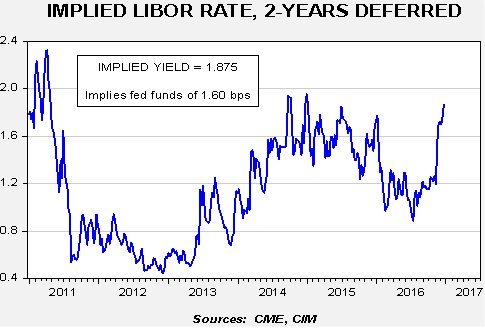
The jump in yields since Trump’s election has been striking. We are approaching the highest level of implied rates since the “taper tantrum.” This rise triggered the onset of the dollar rally in mid-2014 and we note that the dollar has been rising since the election.
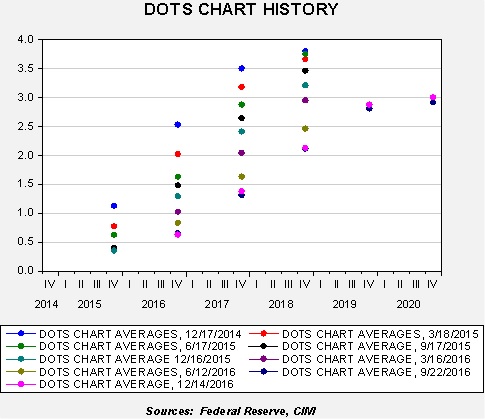
The fuchsia dots represent yesterday’s report. It is important to note that the dots have stopped their steady progression to lower levels. For better or worse, the path of policy expectations from the dots suggests that the FOMC is becoming comfortable with this path of hikes.
So, unexpectedly, the FOMC was hawkish yesterday. It is projecting three hikes in 2017 and 2018. As the dots chart history shows, what tends to occur is that rate forecasts fall as time passes. That pattern appears to have stopped. Normalization of monetary policy appears to be accelerating. Adding to the hawkish tone was a warning of sorts from Chair Yellen who, in the press conference, downplayed the need for fiscal stimulus, a key element of the Trump platform. Thus, if Trump is able to push through a significant stimulus package, it is possible the FOMC could become even more hawkish.
Although the reaction in Treasuries is remarkable, the dollar’s rally is equally impressive. Here is one of the key reasons why.
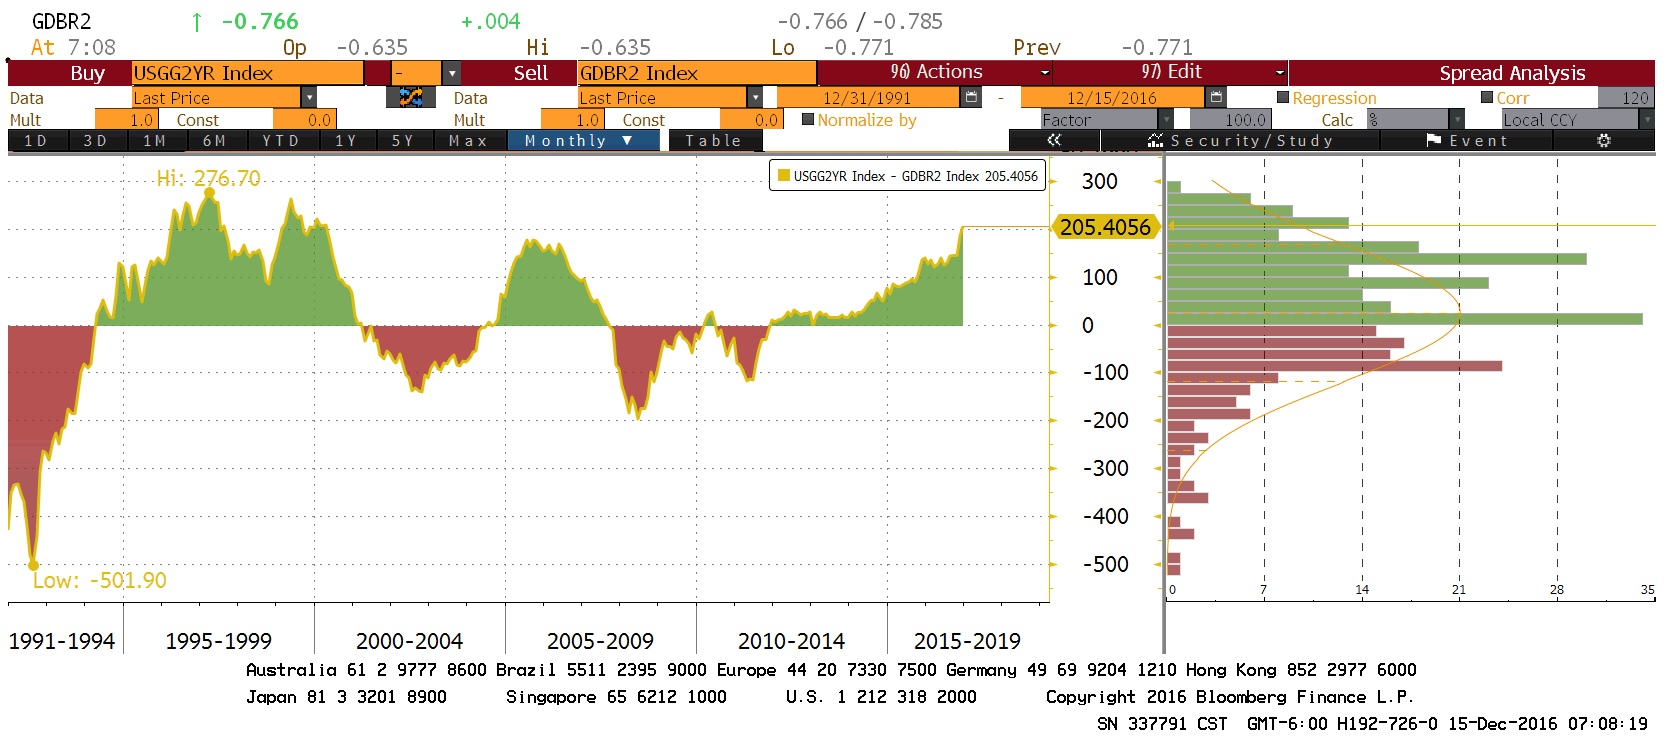
This chart shows the spread between the U.S. and German two-year sovereigns. The spread has widened to its highest level since the late 1990s. By 2000-01, the €/$ exchange rate had fallen well below parity. If this rate spread persists, the dollar will rise further and act as a policy tightening.
We have been closely monitoring the evolution of the incoming Trump presidency to see which constituent group he will favor. Colloquially, we have framed this as Bannon v. Ryan, although Chief of Staff Preibus is a key player as well. Preibus did an interview with conservative radio host Hugh Hewitt yesterday where he suggested that Trump’s primary agenda will be to change the Affordable Care Act (ACA) and tax cuts. Politico reported that a “surprising” number of Democratic lawmakers are “open” to replacing the ACA, probably because so many Democratic Party senators are up for re-election in 2018. At the midterms, 25 Democrats are facing re-election and 10 of those states were won by Trump.
What appears to be shaping up is that the GOP establishment is planning to radically change the ACA in return for tax cuts, assuming that Obamacare will be popular with right-wing populists. This has the potential to be a major mistake. Although the ACA isn’t popular, it may not be for the reasons the establishment thinks. The establishment seems to believe the unpopularity is because of the government’s interference in medical care; more likely, it’s because the ACA didn’t produce what populist America really wanted, which is unlimited free health care. Gutting the ACA and leaving lower income Americans without health care could prove to be a disaster for the GOP. And, tax cuts won’t really help the bottom 80%.
We want to stress that President-elect Trump is capable of aggressive shifts in policy. He could surprise the establishment and press for trade restrictions and infrastructure spending after all, but pushing a populist agenda with the cabinet he has constructed so far may be difficult. If he disappoints the populists, 2020 could be another change election.
In our recently published 2017 Geopolitical Outlook we warned of a series of elections in Europe that could lead to further populist power in the region. Another may be brewing. Greece is in the midst of an impasse with its creditors and the European Stability Mechanism leadership has frozen its payments on a €86 bn support package. The Tsipras government implemented a series of social spending measures and, in response, the EU has suspended support. If the economy collapses, we could see snap elections and perhaps the decision by Greece to exit the Eurozone.
U.S. crude oil inventories fell 2.4 mb compared to market expectations of a 1.5 mb draw.
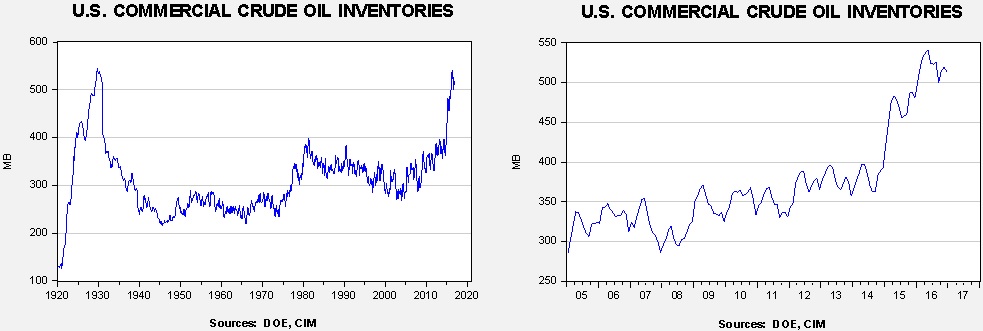
This chart shows current crude oil inventories, both over the long term and the last decade. We have added the estimated level of lease stocks to maintain the consistency of the data. As the chart below shows, inventories remain elevated.
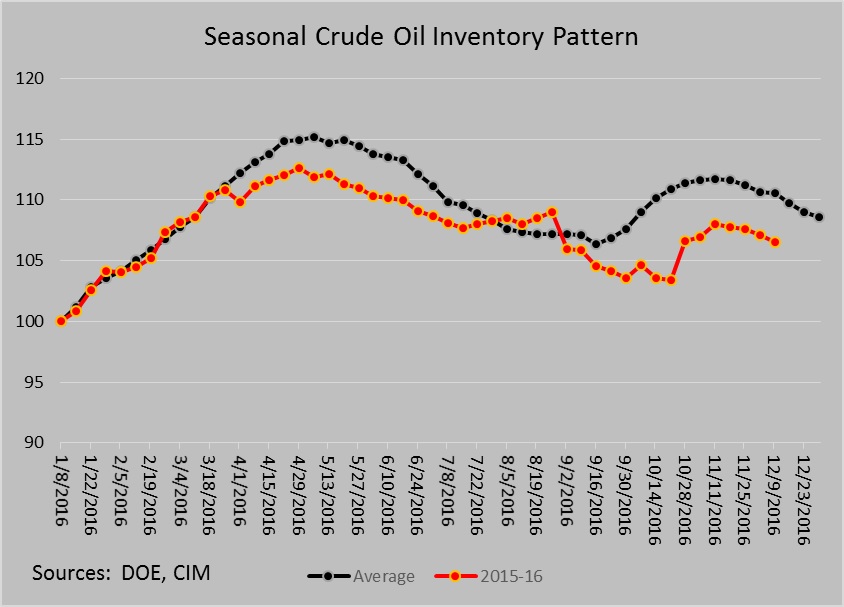
The annual seasonal pattern suggests inventories should decline into year’s end. This week’s data is consistent with that relationship.
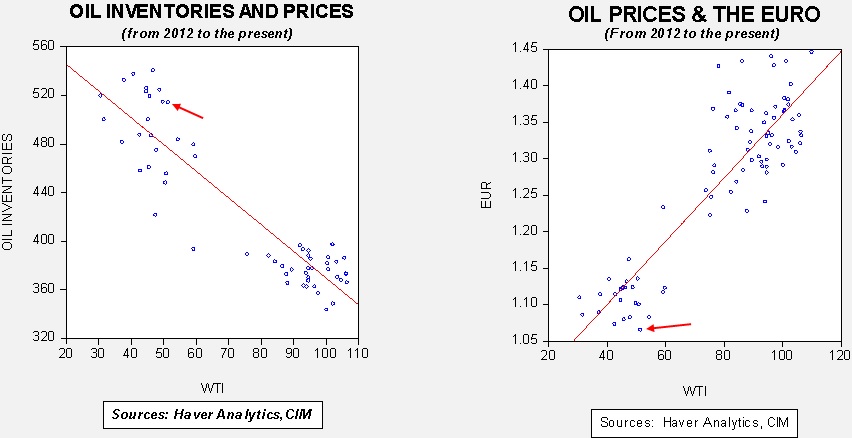
Based on inventories alone, oil prices are overvalued with the fair value price of $41.25. Meanwhile, the EUR/WTI model generates a fair value of $36.82. Together (which is a more sound methodology), fair value is $37.49, meaning that current prices are well above fair value.[1] OPEC has managed to lift prices but maintaining these levels will be a challenge given the dollar’s strength and the continued elevated levels of inventory.
_________________________________
[1] The reason the combined model is calculating a fair value price below the individual models for the euro and oil stocks is due to the fact that the euro and oil stocks are collinear. In other words, the euro and oil stocks are correlated at -88.8%, meaning a weaker euro usually means higher oil stocks. The fact that oil inventories are falling into a weakening euro is unusual.