

Daily Comment (April 6, 2017)
by Bill O’Grady, Kaisa Stucke, and Thomas Wash
[Posted: 9:30 AM EDT] Most of the time, Fed minutes are snoozers. On the other hand, there is often real action within the FOMC. The full meeting transcripts are published with a five-year lag and they show verbal sniping and open disagreement. By contrast, the minutes are sanitized with code words like “some members” or “many members” to give hints at the degree of support or opposition. Most of the time, the minutes are nothing more than a longer version of the statement.
However, that was not the case yesterday. The FOMC made its clearest signal yet that it intends to shrink the balance sheet. The general expectation was that the Fed would allow the balance sheet to slowly unwind by not buying bonds when paper matures. However, that doesn’t seem to be what the FOMC is saying; instead, it appears to be looking to actively reduce the size of the balance sheet.
This is a big topic that will require deeper analysis. To be completely clear, no one knows for sure exactly how the balance sheet expansion affected the economy and the markets. We can look at market effects, but we can’t tell for sure why those factors worked the way they did. We can make a very good case that QE was good for stocks.
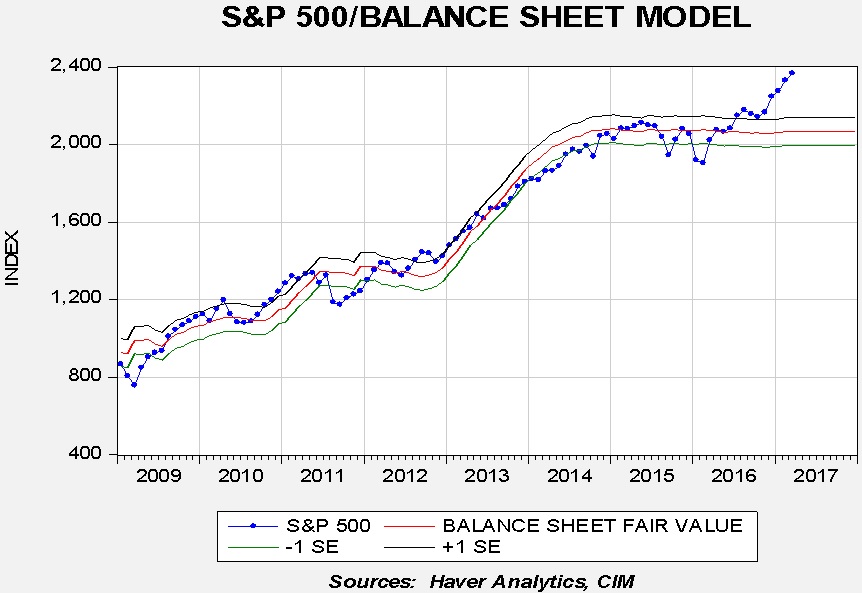
The chart above shows the S&P 500 regressed against the Fed’s balance sheet. From 2009 until the middle of last year, the model did a good job of projecting the path of equities. Since the Trump election, equities have moved sharply higher. Our position was that the actual effect of QE was to boost equity market sentiment.
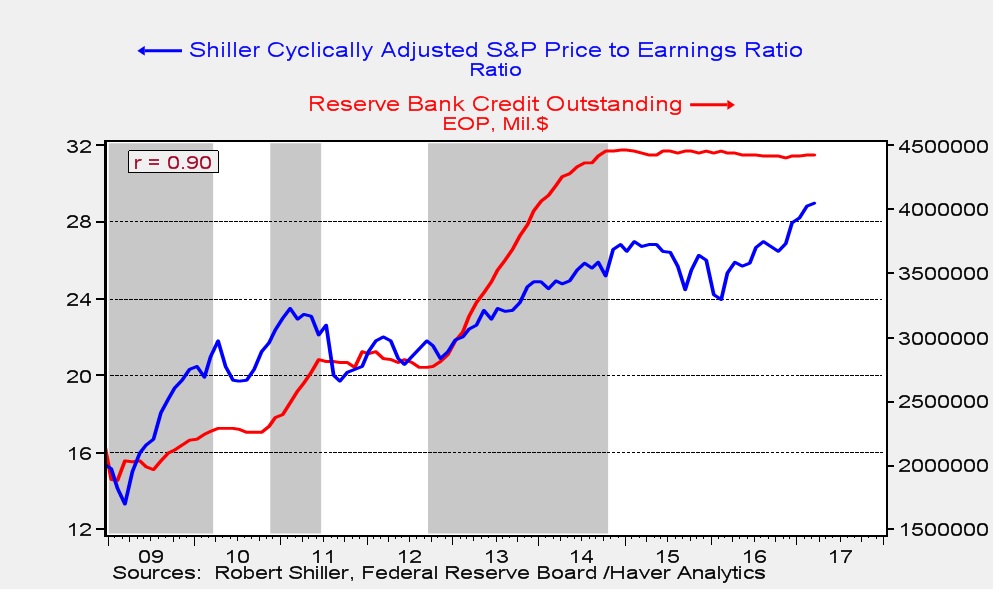
The chart above shows the Shiller CAPE and the balance sheet. Periods of QE are shown in gray. Note that the P/E tended to rise when the balance sheet expanded. Obviously, the most recent lift isn’t being caused by policy but by the election.
Perhaps the most underappreciated element of QE was the impact on long-duration interest rates. One of the reasons for implementing QE was to lower long-term interest rates. However, the evidence suggests the impact was just the opposite of what policymakers expected.
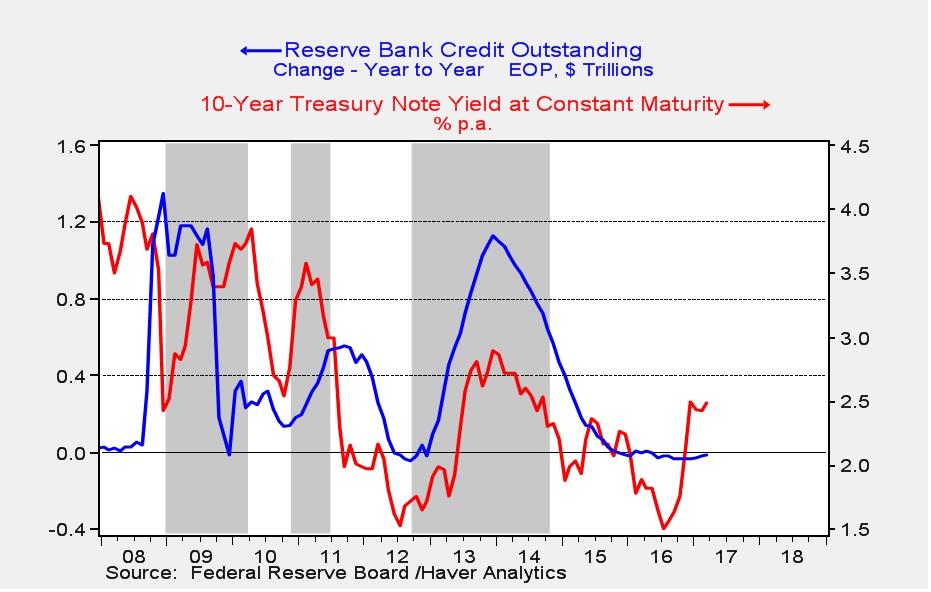
This chart shows the yearly change in the size of the balance sheet along with the yield on the 10-year Treasury. Note that, especially with QE2 and QE3, yields tended to rise during periods of balance sheet expansion. Although the common expectation is that yields will rise once the reversal begins, in fact, we would be more inclined to expect bond prices to rise. Why did bond yields rise during QE when the Fed was buying longer dated paper? Most likely, investors feared the goal of policy was reflation; rising inflation is always negative for bond prices and those fears overwhelmed the impact of reduced supply.
However, we are cautious about drawing too many conclusions from these patterns. We have no experience with cutting the size of a balance sheet this large. On the one hand, it shouldn’t make much difference. The rise in the balance sheet did nothing more than bloat the banking system with reserves that, for the most part, have not been lent. Reducing excess bank reserves shouldn’t be a big deal. On the other hand, QE and the balance sheet were symbols of Fed policy support. The psychological impact could be quite negative. We will have more to say on this going forward, but our initial read is that balance sheet reduction could be bearish for equities and bullish for bonds. Then again, the impact may not be large and could be overwhelmed by other issues, such as tax changes, geopolitical events, etc.
In other news, the China/U.S. summit begins later today. We would not expect much to happen here as the Chinese leader needs a “no drama” meeting. The Czech Republic ended its peg with the EUR; since mid-2015 the Czech central bank has pegged the koruna/euro rate at 27.0313. It has rallied about 0.5% on news that the Czech government will allow its currency to strengthen.
Stephen Bannon, special advisor to the president, was pulled off the National Security Council yesterday in a clear win for the establishment. Our read is that the key power broker is Jared Kushner and there have been rumors that Bannon and Kushner’s relationship has cooled in recent months. Some reports suggest Bannon was prepared to resign but the Mercers pressed him to stay. Gary Cohn, the White House economic advisor, apparently asked some senators about Glass-Steagall in a private meeting. According to Bloomberg,[1] Cohn expressed support for bringing the separation of investment and commercial banking back to the financial system. This is a bit of a shock coming from Cohn but it may be a trial balloon to see if Congress would support such a measure. Bannon’s fall from grace is a blow to the populists, while Glass-Steagall would be a win for this group.
Overall, in our establishment/populism “meter” the former is gaining strength. If the establishment gains power, financial markets will favor this outcome. However, populism isn’t going away and moving in this direction leaves President Trump vulnerable to a challenge from a leftish populist in 2020…if and only if the Democrat Party sees the opening.
U.S. crude oil inventories rose 1.6 mb compared to market expectations of a 1.5 mb draw.
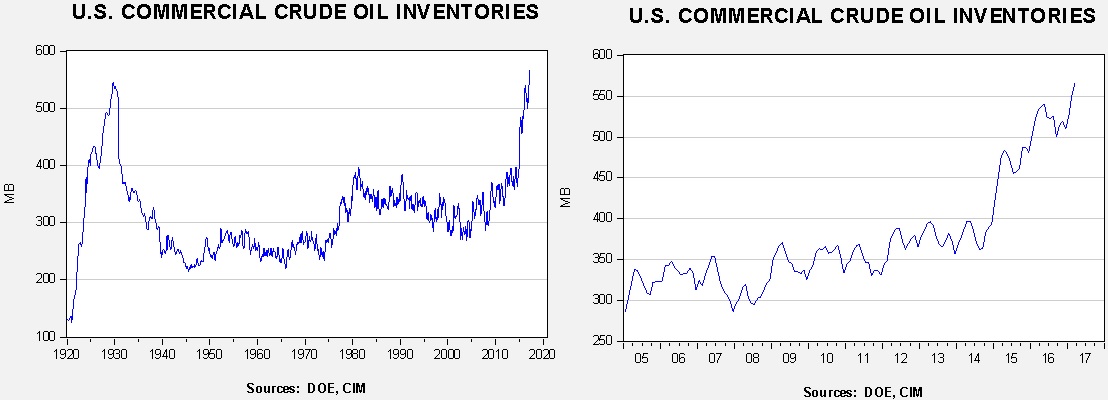
This chart shows current crude oil inventories, both over the long term and the last decade. We have added the estimated level of lease stocks to maintain the consistency of the data. As the chart below shows, inventories remain elevated.
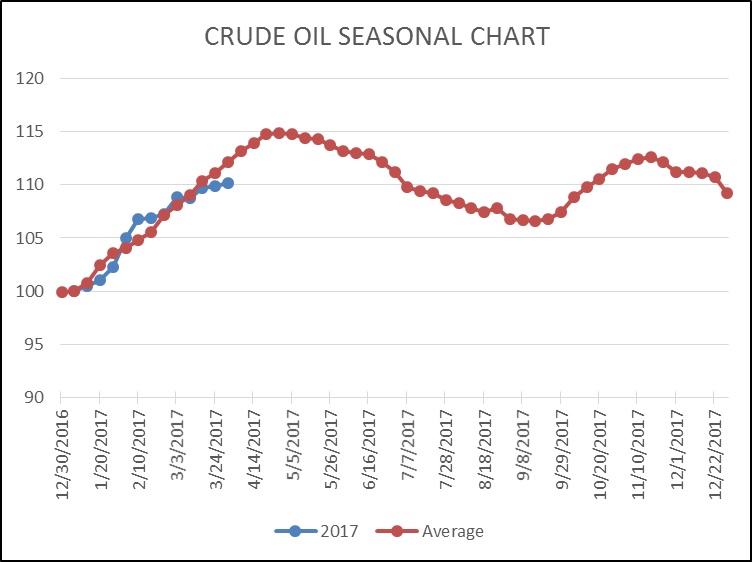
As the seasonal chart below shows, inventories usually increase for the next three weeks before rising refinery operations for the summer driving season lower stockpiles. This week’s smaller than seasonal rise puts us further below normal. Although inventories remain high, this seasonal level is consistent with early July, meaning that we may be on the way to an easing of the inventory overhang.
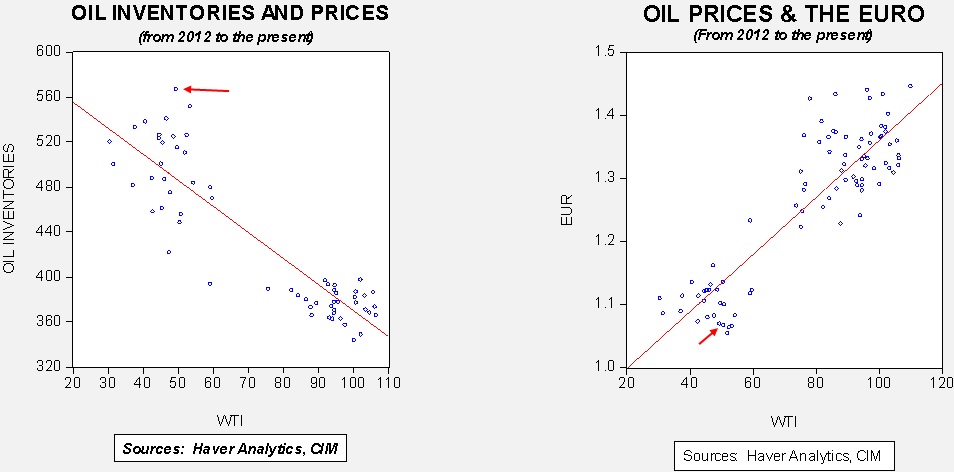
Based on inventories alone, oil prices are overvalued with the fair value price of $26.81. Meanwhile, the EUR/WTI model generates a fair value of $40.66. Together (which is a more sound methodology), fair value is $35.36, meaning that current prices are well above fair value. The data indicate that the bullish case for oil mostly rests on a weaker dollar. If the dollar continues to soften, coupled with the usual seasonal decline in oil inventories, our models will raise the fair value level. That isn’t necessarily bullish for oil prices but it does remove a potentially bearish factor. Simply put, current oil prices have already factored in a drop in inventories and likely a weaker dollar.
________________________________________
[1] https://www.bloomberg.com/news/articles/2017-04-06/cohn-said-to-back-wall-street-split-of-lending-investment-banks