

Daily Comment (April 27, 2017)
by Bill O’Grady, Kaisa Stucke, and Thomas Wash
[Posted: 9:30 AM EDT] ECB President Draghi is speaking at the time of this writing. Nothing has changed in terms of policy, but Draghi’s assessment of the economy is somewhat supportive, although still rather cautious. Initially, forex markets took his comments as modestly dollar bearish. However, in the Q&A, Draghi made it clear that no path of tapering has been decided which reversed dollar weakness. Treasury yields have turned higher in the wake of his comments. Overall, there wasn’t much to signal that the ECB will be tightening soon and so we are seeing a weakening of the EUR.
The White House sent a scare through the media last night by indicating that the U.S. is preparing to leave NAFTA, which would effectively kill the organization. However, that leak was quashed; the president did indicate he wanted to renegotiate the treaty but that was his position during the campaign. It is unclear what triggered the outburst, other than it may have been driven by the desire to make a splash for the 100-day mark. On this topic, we are not going to make any further comments about the tax proposal until we see more detail and can assess its chances of passage.
U.S. crude oil inventories fell 3.6 mb compared to market expectations of a 1.9 mb draw.
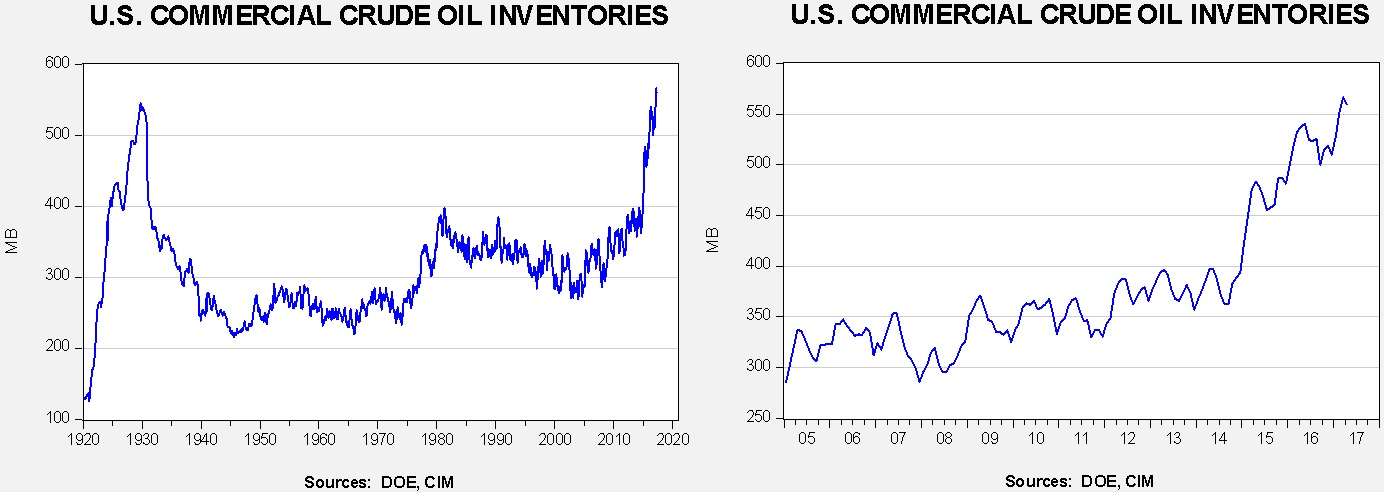
This chart shows current crude oil inventories, both over the long term and the last decade. We have added the estimated level of lease stocks to maintain the consistency of the data. As the chart shows, inventories remain historically high.
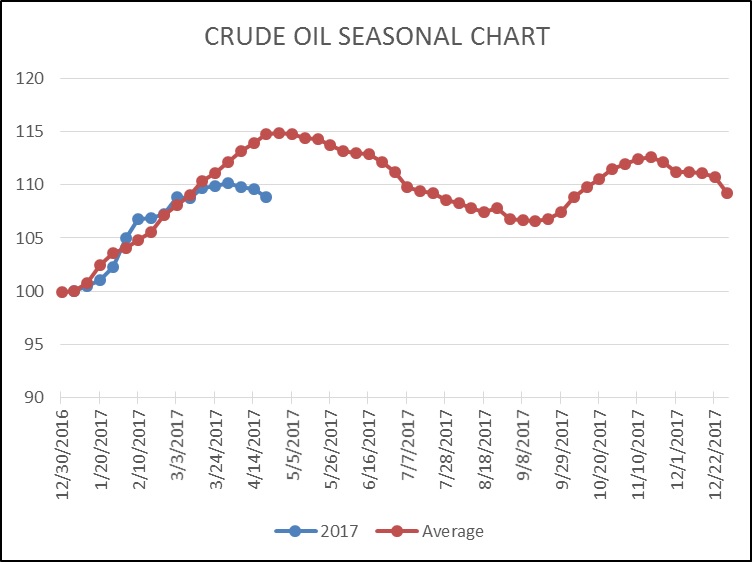
As the seasonal chart below shows, inventories are near their seasonal peak and begin falling as rising refinery operations lower stockpiles. This week’s decline puts us further below normal. Although inventories remain high, this seasonal level is consistent with July, meaning that we may be on the way to an easing of the inventory overhang. Last year, we saw a draw of roughly 45 mb from the April peak. Assuming a similar drop from this year’s peak of 566.5 mb at the end of March, we will end up at 520 mb by late September. Assuming a $1.09 EUR and using the model discussed below, fair value for oil prices is $44.15. Thus, we would need to see a much larger drop to justify current prices.
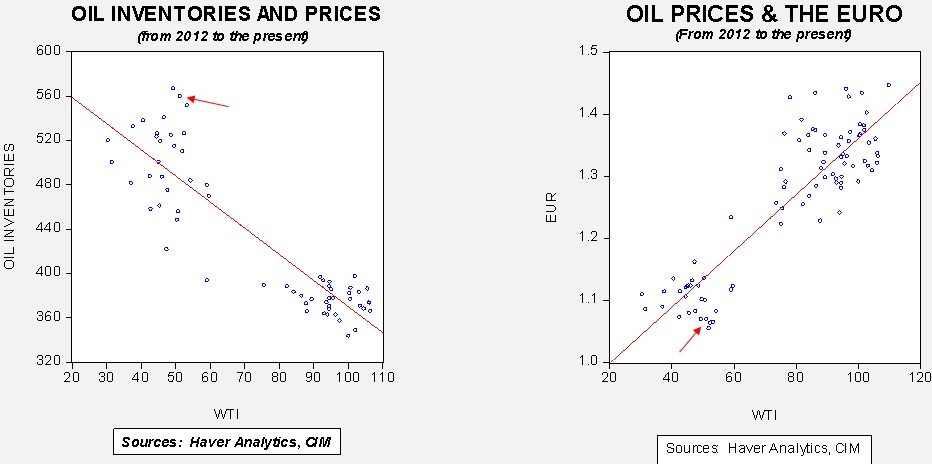
Based on inventories alone, oil prices are overvalued with the fair value price of $30.78. Meanwhile, the EUR/WTI model generates a fair value of $41.25. Together (which is a more sound methodology), fair value is $37.39, meaning that current prices are well above fair value. To a great extent, it appears that the oil market has already discounted a drop in inventories and a weaker dollar.
A key factor lowering inventories is that refinery output is unusually strong.
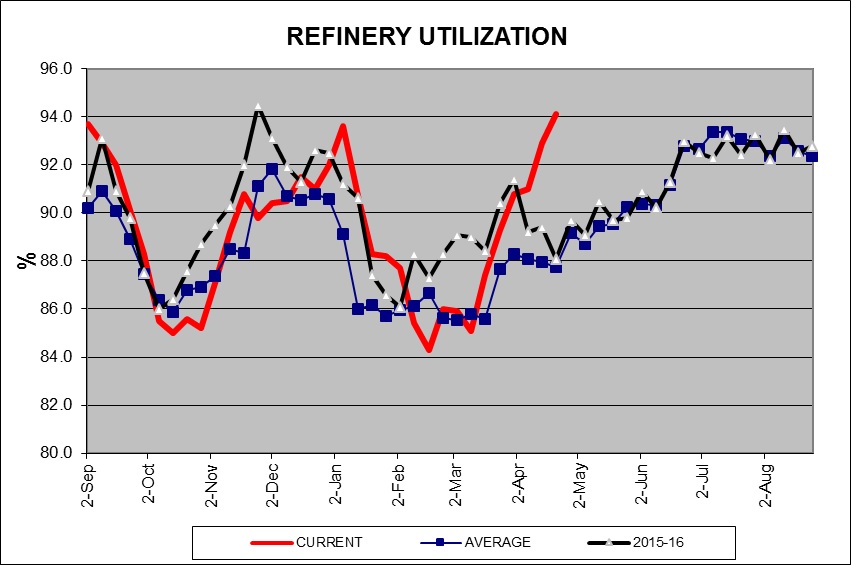
This chart shows the level of refinery utilization as a percentage of total capacity. Last week’s data hit 94%, which is rather high for this time of year. We do expect a good summer driving season as the economy isn’t in recession and consumer confidence is elevated. Still, given that gasoline stockpiles are ample, we doubt this level of activity will rise much more from current levels.
On gasoline, relatively low prices should be supportive for consumption.
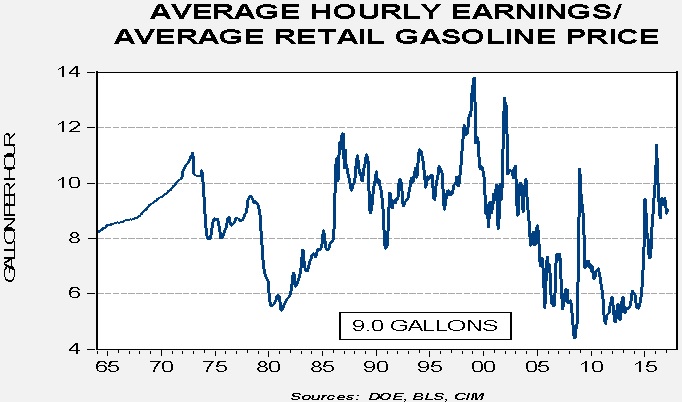
This chart shows the current average retail gasoline price divided into average hourly earnings for non-supervisory workers. This tells us how many gallons a worker can purchase by working one hour. The average since 1964 has been about 8.6 gallons per hour so the current price, relative to earnings, is not high enough to dampen consumption.
However, we do have concerns about gasoline consumption.
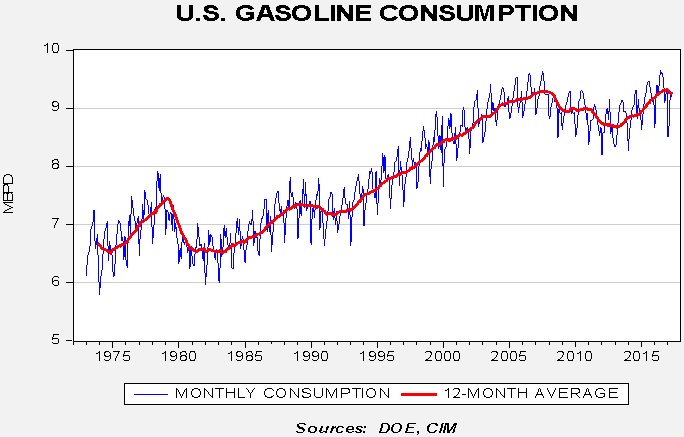
The blue line shows the monthly level of consumption, which is obviously sensitive to seasonal factors. The red line is the 12-month moving average. Note that the average began to strongly recover beginning in 2013 but we have been seeing evidence of slowing demand over the last quarter. This slowing of consumption is worrisome given that prices are not unusually high, employment levels are rather strong and consumer confidence is elevated. It is possible that we are seeing evidence of “peak demand” for the U.S. From 1980 to 2006, with a couple of exceptions, gasoline consumption has steadily increased. This may be due to demographic issues, such as a rising number of baby boomers driving less and millennials driving less as a lifestyle preference, meaning that the uptrend is permanently broken. If that is the case, it’s going to be difficult to work off the U.S. oil inventory overhang unless we see a rise in exports. Our position on oil is that we are in a trading range between $45 and $55 per barrel.