

Asset Allocation Weekly (November 4, 2016)
by Asset Allocation Committee
With the elections coming next week, it seems like a good time to look at how markets have historically performed during election cycles. We will compare the current election cycle against previous cycles.
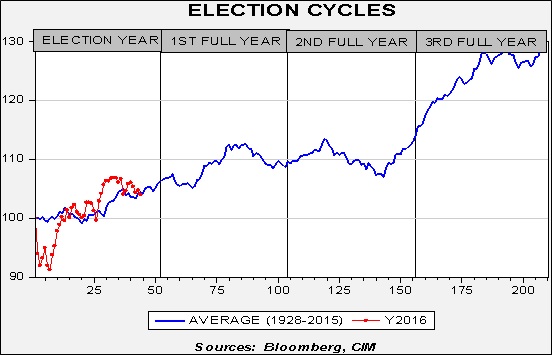
The blue line in the chart above shows the indexed market return for the period 1928-2015. To create this average cycle, we use the weekly returns of the S&P 500 Index starting with the first week of the election year through the end of the fourth year of the presidential term. The weekly dataset begins in 1928. The average gain in the first year of the cycle is about 6%. By Q3 of the second year of the cycle, the average return of the S&P 500 is approximately 13%. Equity markets move sideways to lower into late Q3 of the third year and then, on average, stage a strong rally into the last year before the election cycle begins anew. The rally that begins in year three is a fairly well documented phenomena; politicians want to be re-elected and thus create policies that boost growth and, on average, lift equity prices as well. We have added the S&P 500 performance for the current cycle, indexed to the first Friday close of 2016 (red line). Although the market has been volatile, its performance has been close to average since the dip in Q1.
To further analyze the data, we break the historical data into four categories: incumbent Democrat president, incumbent Republican president, new Democrat president and new Republican president. We define incumbent as a consistent party in power. For example, this means we had a Democratic incumbent from 1936 through 1951, which encompassed both Roosevelt and Truman. Similarly, we had an incumbent GOP from 1984 through 1991 which included Reagan’s second term and Bush’s only term.
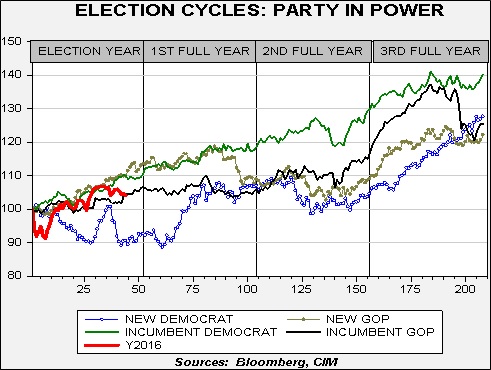
As the chart shows, markets have had the best outcome when an incumbent Democrat wins. A new Republican president tends to track an incumbent Democrat until the year after the election, then underperforms. A new Democrat has historically been the worst outcome for the market (excluding the late 4th year rally). The current cycle is mostly following the incumbent Democrat/new Republican averages, suggesting that the equity market isn’t offering significant insights thus far. However, it does imply that, regardless of the outcome on Tuesday, we will likely see a recovery into the New Year in that we will either have a new GOP president or an incumbent Democrat president.
Although most analysts are assuming a Clinton win based on polling, this analysis does suggest some equity market trepidation as we are currently underperforming both of the most probable outcomes.[1] This underperformance could reflect the volatile nature of this election season or expectations of monetary policy tightening in December. However, given the usual electoral pattern, we would not be surprised to see a stronger equity market into at least the first half of next year.
_________________________
[1] It is possible a third party could win, but highly improbable. The most likely outcome is either an incumbent Democrat or a new Republican.