

Asset Allocation Weekly (May 25, 2018)
by Asset Allocation Committee
Last week we discussed the general idea of secular versus cyclical trends. This week we will look at these concepts with regard to longer duration fixed income.
The goal of theory is always to simplify. Theorizing is all about taking complex phenomena and reducing it to basic elements that can guide us in estimating the future. However, as Albert Einstein noted, “Everything should be made as simple as possible, but not simpler.” The yield on sovereign debt instruments should be a function of the policy rate and inflation expectations. The longer the duration of the instrument, the more important inflation expectations are to the yield. However, specific historical conditions do count. For example, a nation’s credit risk can change over time; government borrowing behavior can play a role. Even geopolitical risks can matter; Tsarist bonds traded at 95 rubles to par of 100 in late 1914, only to have the debt later repudiated by the Bolsheviks.[1] Thus, secular trends can abruptly change if underlying conditions adjust significantly.
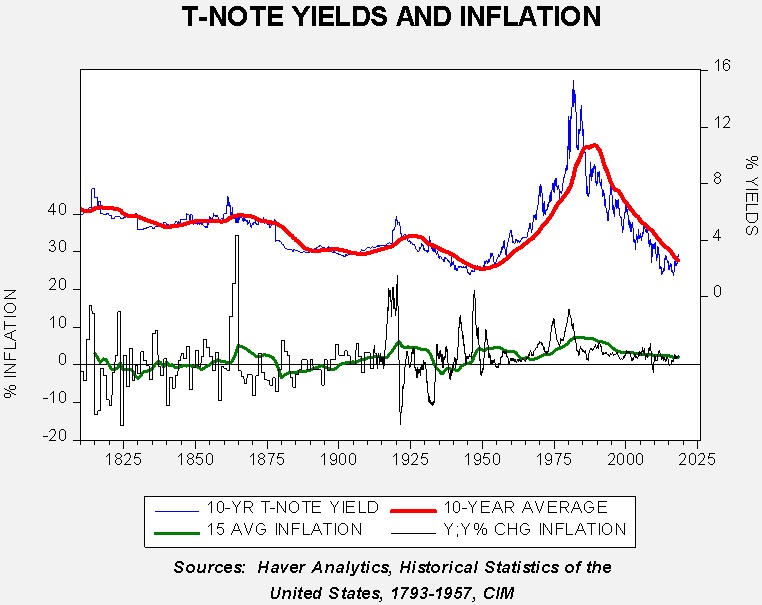
The above chart looks at inflation trends and the yield on 10-year T-notes. For inflation, we use CPI from 1915 to the present; the data prior is the General Price Index. Although not perfectly equivalent, the two indices do give general insight into inflation. We have added a 10-year average of yields and a 15-year average of inflation to highlight the trends in the data.
Inflation behavior until the 1930s was rather erratic. This was because the U.S. was on the gold standard and the money supply was partly driven by mining activity and partly driven by industrial activity. In other words, deflation is highly likely if the money supply is fixed while output is rising rapidly (as was the case during the industrial revolution).
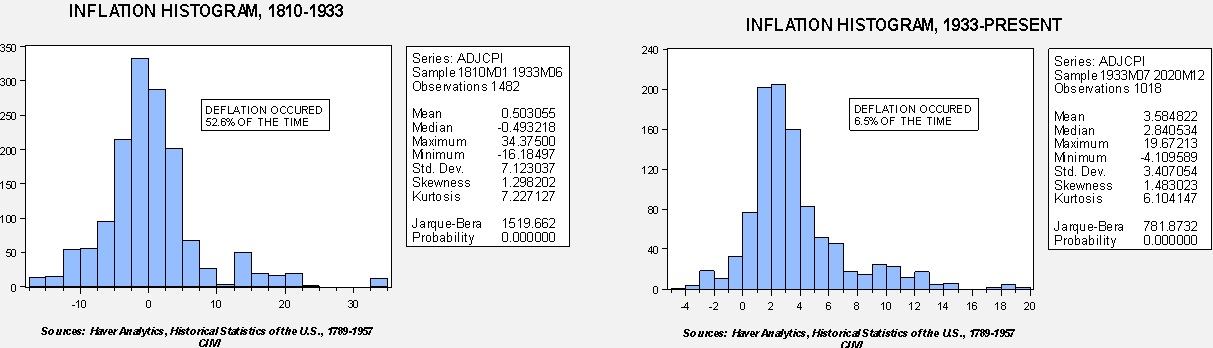
These charts show the behavior of our inflation series; the chart on the left shows the dispersion during the years 1810 until June 1933, when President Roosevelt ended the ability of citizens to hold gold. The average inflation rate over this time frame was a mere 0.5%; however, range was wide. Note that the highest rate recorded was 34.4% during the Civil War and the lowest was 16.2% during a downturn after there was a lull in public investment. During this period, deflation occurred almost 53% of the time. After June 1933, the average inflation rate rose to 3.6% but the range narrowed significantly, from 19.7% after WWII to a low of -4.1% during the 1936-37 recession. Deflation only occurred 6.5% of the time after Roosevelt ended the gold standard. Economists discovered that people have an asymmetric response to inflation and deflation—rising prices tend to spur buying which supports growth, while deflation can lead consumers to stop buying in anticipation of even lower future prices.
It would be reasonable to assume that longer duration yields would be rather low during the period when deflation was common. In fact, they averaged 4.6% in the years from 1810 to 1933. Yields remained low during the Great Depression, and, during WWII, the Treasury forced the Federal Reserve to keep rates low to reduce borrowing costs. Thus, the “modern era” really begins in March 1951 with the Federal Reserve-Treasury accord. That pact allowed the Federal Reserve to set interest rates based on economic conditions. In theory, central bank independence is generally thought to lead to better inflation control. In the absence of an external restraint on money creation, i.e., gold, central bank independence should create conditions of better inflation control. However, from the 1950s into the early 1980s, the Federal Reserve raised short term interest rates to try to quell steadily rising inflation. Since the policy rate acts as an anchor for longer duration instruments, T-note yields rose during this period. The average yield on T-notes from March 1951 to the present is 5.1%. However, as the above charts show, long-duration rates steadily rose until the early 1970s and then rose rapidly with each business cycle until peaking in late 1981. By the late 1970s, policymakers were moving aggressively to contain inflation through strict monetary policy, deregulation and globalization. Those policies triggered a secular bull market in bonds that continues to this day.
We believe this bull market in bonds is likely nearing an end. Populism is becoming an increasingly potent force throughout the West. In general, populism usually leads to re-regulation and deglobalization. These factors should, over time, lead to steadily rising inflation and bond yields.
Our base case is that we will likely see a gradual increase in yields over the next 10 to 20 years. We do not expect that increase to be sudden, but do look for higher high yield and higher low yield in each business cycle. The asset allocation committee believes this situation can be managed with a modest shortening of duration and the use of “ladders” using target-date exchange-traded products.
However, as part of our scenario planning, there is the possibility that we may see discrete jumps instead of a gradual increase in interest rates. This is due to the generational experience of inflation.
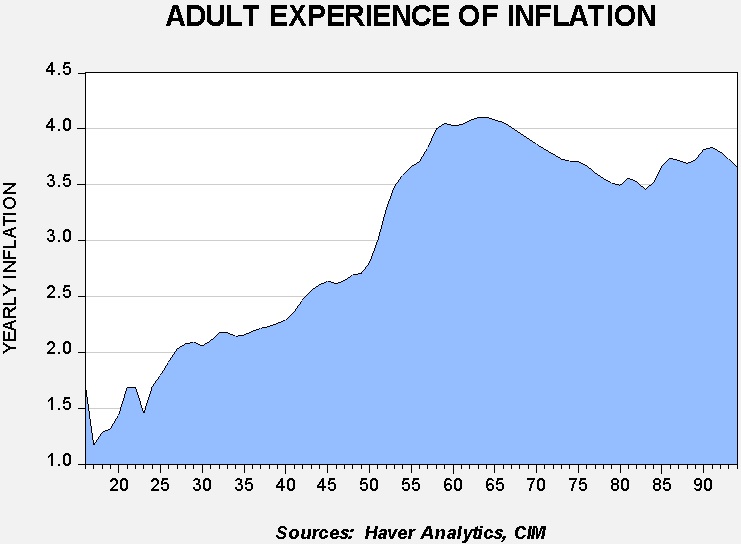
This chart shows the adult experience of inflation, starting with age 16. The current 64-year-olds have experienced the highest average adult inflation, at 4.1%. Note that the experience of inflation declines rapidly for the current age cohort in their 50s. Over time, the area of the graph will shift to the right, meaning that society’s memory of the high inflation years will gradually diminish. However, that isn’t the case now; a significant cohort remembers inflation and, if populist policies expand quicker than we expect, the baby boom generation could react strongly and trigger inflation fears.
If inflation fears are triggered, we could see a bear market in bonds develop characterized by rapid spikes in long-term interest rates that choke off growth and lead to less stable financial markets and shorter business cycles. This is not our base case. However, the particular demographic pattern could lead to this outcome, which we will monitor closely.
[1] http://www.helsinki.fi/iehc2006/papers1/Oosterli.pdf, page 34.