

Asset Allocation Weekly (January 5, 2018)
by Asset Allocation Committee
Equity markets had a very strong 2017, with the S&P 500 up over 20% for the year. Earnings rose more than expected, the economy continued to expand and investor sentiment was buoyant, all of which contributed to rising equities. The tax bill, signed in late December, will give equities a lift going into 2018. In this report, we will examine equity market behavior as part of the presidential cycle.
To perform this exercise, we look at weekly closes for the S&P 500 starting in 1928. We rebased the index for every four-year election cycle, so the first year is the actual election year (with elections held in November) along with the next three years of the term. Using this database, we can sort by incoming party, incumbent party, high correlating terms, etc. Earlier this year, we published this graph.
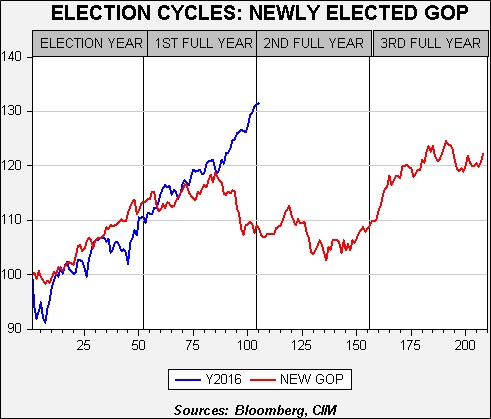
The red line on the chart shows the average S&P 500 performance for a new GOP president; the blue line shows the performance during the Trump administration. From the beginning of 2016 into Q3 2017, the two lines closely followed each other. However, they have diverged rather dramatically since then. We suspect that the anticipation of tax reform has led to the sharp rise in equities.
The real question is how will equities perform in 2018? The tax reductions built into the tax bill will likely have a significant impact on corporate earnings; we will have more to say about that in subsequent reports. However, another way to look at equities is by comparing the performance of the current Trump term to other four-year cycles.
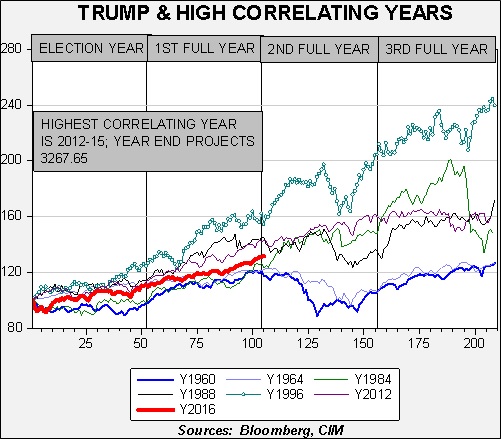
There are six other periods that correlate at 90% or above. Three of the six show weakness in the second full year of the administration, 1960-63, 1964-67 and 1988-91. In the first instance, the Cuban Missile Crisis likely led to the pullback. The escalation of the Vietnam War and rising inflation (the highest rise in the CPI in nine years) weighed on equities in 1966. The First Gulf War and the 1990-91 recession were behind weaker equities in the 1988 cycle. The other three had mostly rising equity values in the second full year of the political cycle.
Interestingly enough, the highest correlating cycle is 2012-15, the second Obama term. Although the current index is running a bit behind compared to that year, the index pattern is most similar. If we continue to track that cycle and narrow the gap, the S&P 500 would end up at 3267.65 at the end of 2018.
How is this exercise useful? This analysis looks at high correlation periods and projects what may occur assuming that no major exogenous events occur. Obviously, a war or recession would lead to different outcomes. But, if the U.S. avoids an economic downturn or a major political or geopolitical event, equity markets could have another strong year.