

Asset Allocation Weekly (January 26, 2018)
by Asset Allocation Committee
Equity markets have been steadily rising, with the major indices making a series of new all-time highs. The recent impetus to equities has been the tax law. As we detailed in our recent addendum to our 2018 Outlook,[1] the tax bill will shift about 1.3% of GDP to after-tax corporate profits. This development led us to raise our forecast for the S&P 500 to 3056.12 for 2018. At the same time, we realize bear markets do happen. So, what do we think as the market keeps trending higher?
In our 2018 Outlook[2] we detailed our views on the economy and how the economy affects equity markets. In summary, since 1987, each bear market in equities has coincided with economic recession. There is no evidence at present that a recession is looming in the near future; however, we do pay very close attention to the two major causes, geopolitical events and monetary policy mistakes, and will try to warn readers if we see anything looming.
This report, instead, is going to focus on short-term market factors. The steady rise in equities fosters both fear and greed. Here are some of the factors we are watching:
First, investor sentiment is elevated. The American Association of Individual Investor Sentiment Index is elevated; in fact, the ratio of bulls/bears is 5.25, wider than before the 1987 crash. Another sentiment indicator we monitor, from Ned Davis, tells a similar story.
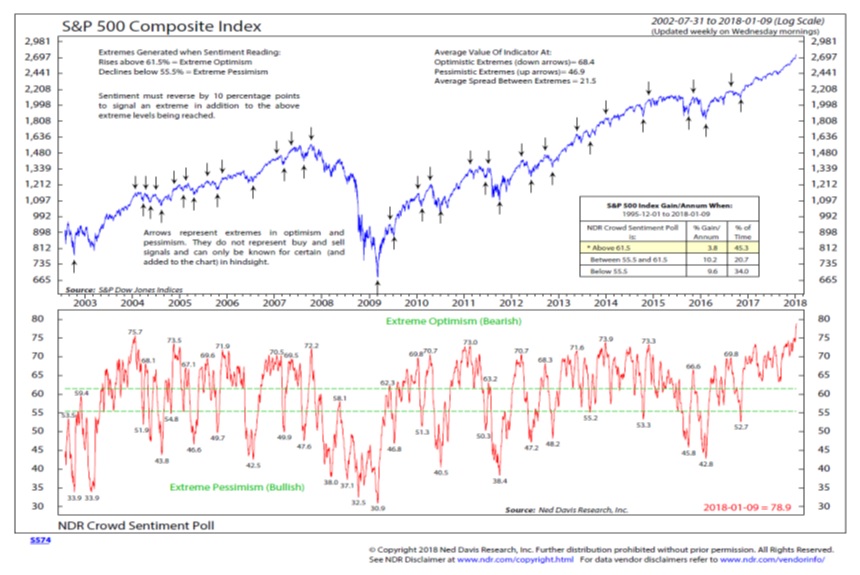
The theory behind these sentiment indicators is “contrarianism.” Contrarianism is based on the idea that what the crowd believes is probably either (a) wrong, or (b) already discounted by the market. In other words, once investors become extremely bullish, not only does the price probably contain that sentiment, but high sentiment means there probably isn’t more upside left. Another variation of this theory can be seen in famous magazine covers, like The Economist predicting $5 crude oil in the late 1990s very close to the bottom around $10 per barrel.
Still, it is evident from the above chart that sentiment alone isn’t reliable. After all, Ned Davis uses a reading above 61.5 as an indicator of elevated sentiment; based on this figure, sentiment has been elevated since last November’s election with no significant declines in equity prices.
Second, another factor we monitor is the level of money market funds held by retail households. Since the recovery began in 2009, equity markets have tended to do well as long as money market funds exceed $920 bn. But, if money market funds fall below this level, equity markets seem to stall, most likely due to the lack of liquidity. The combination of liquidity and sentiment appears to offer better insights into market behavior than just sentiment alone.
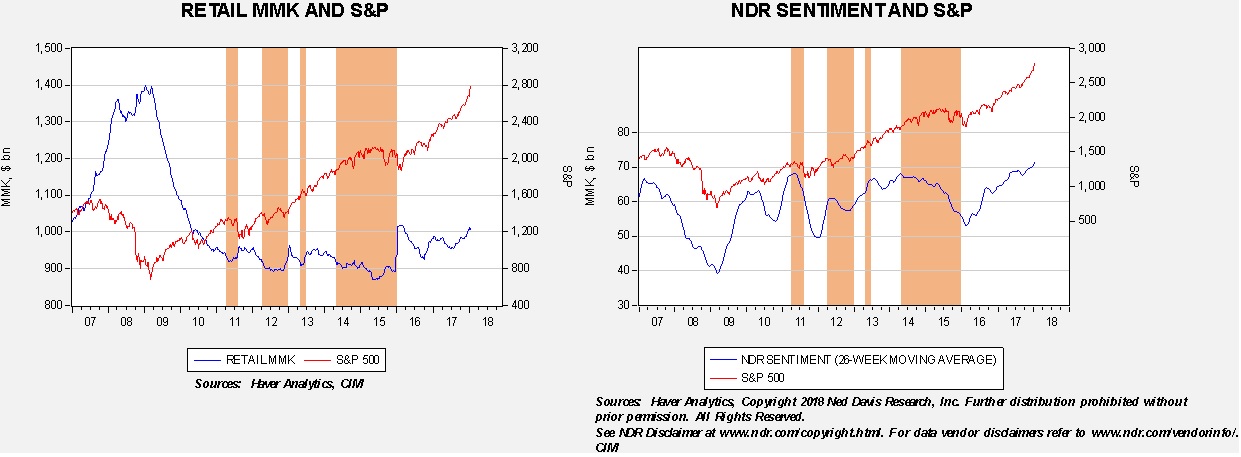
The chart on the left shows household money market funds. We have placed orange shading on periods when money market funds fell below $920 bn. Note how equity markets tended to stall once liquidity became tight. On the right, we use the same shading (indicating a low level of available liquidity) and the 26-week moving average of the NDR Sentiment Indicator. This shows that high levels of sentiment with ample cash levels tend to support high equity prices, whereas a reading over 60 on the sentiment index and low cash levels tend to lead to a flat to weaker market.
What is salient about the current situation is the combination of elevated sentiment and ample liquidity. Although it is possible that short-term interest rates have risen to a level where investors find them attractive, we rather doubt that’s the case. Over the past few years, elevated levels of cash usually indicate the potential for increased allocation to equities. High money market balances, coupled with elevated levels of investor sentiment, probably signal higher equity values.
That being said, concern about the elevated level of equities is not without merit. There is no doubt we are in the “late innings” of this bull market. After all, the current expansion will soon be the second longest on record. Although expansions don’t die of old age, rising geopolitical tensions and expectations of tighter monetary policy do suggest this bull market may be measured in quarters, not years. At the same time, the combination of strong sentiment and high liquidity suggests that further upside is likely and it is probably premature for investors to become overly defensive.
[1] See 2018 Outlook: Addendum, 1/4/18.
[2] See 2018 Outlook, 11/30/17.