

Asset Allocation Weekly (December 16, 2016)
by Asset Allocation Committee
Equity markets are expensive by numerous measures and have become even more extended in the wake of the “Trump Rally.” As noted in our weekly P/E update (found in the last section of the Daily Comment), our four-quarter measure of the P/E is elevated. Another well-known derivation of the “Buffet Indicator” has also reached lofty levels.
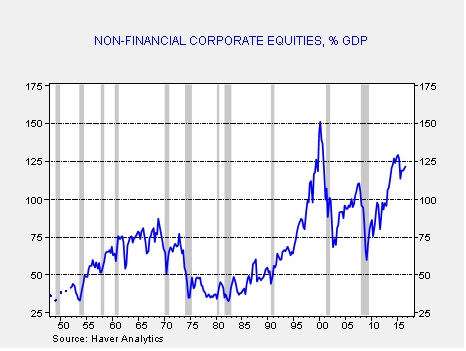
This ratio divides the market value of equities outstanding from the Federal Reserve’s Financial Accounts of the U.S. by GDP. Although the ratio is off its recent highs, it is still at the upper end of its historical range.
At the same time, the optimism isn’t unfounded. Proposals for corporate tax reform could bring repatriation of the more than $2.0 trillion of corporate cash parked overseas. Tax cuts would boost after-tax earnings. The “E” part of the P/E could rise, making the market less expensive. Another factor to note is that investor cash levels remain elevated.
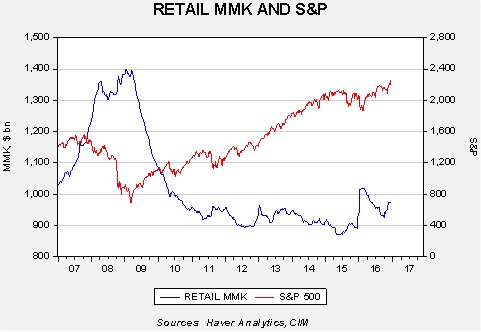
This chart shows the level of retail money market funds relative to the S&P 500. Since 2011, equities have tended to trend higher when money market fund levels exceed $920 bn. Once money market holdings fall below that level, equities have tended to stall. It appears that investors were building cash in front of the election but, so far, retail investors are not aggressively entering the equity markets. The weekly mutual fund flows suggest that investors are selling out of bonds which probably accounts for the recent rise in money market funds; to date, there isn’t any evidence in the same data that equity mutual fund buying is increasing. This data would suggest that there is ample fuel for further gains in equities.
So, if equities are rich but could work higher, how high is high?
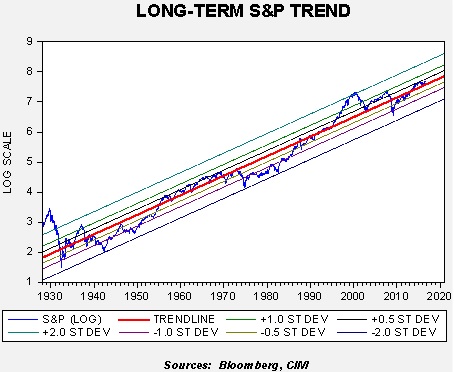
On this chart, we log-transform the weekly close of the S&P 500 starting in 1928. The red line is the long-term trend. We have regressed the trend line against the weekly close and have calculated the standard deviation at the ½ level, one deviation and two deviations from trend. Only twice in the past 88 years has the index exceeded two standard deviations to the upside and it has only touched that level on the downside three times. We are currently below ½ deviation on the upside, suggesting that, on a long-term trend basis, equities are not all that extended.
If we reach +½ standard deviation by mid-2017, the S&P 500 would reach 2480.70; the year-end reading would be 2562.22 by the same measure. By comparison, reading the +one standard deviation line would put the index at 2995.80 by June 2017, and 3094.24 by year’s end. We are not anticipating a rise to +one standard deviation next year but a rise to the +½ level isn’t out of the question.
We still don’t know what the specific policies will be of the incoming Trump administration. Tax policy is complicated and there is always the potential for mistakes. The current euphoria surrounding other policies will probably fade over time. And, although the above analysis suggests that equity markets are sporting high valuations, cash levels are high and current equity levels, while above trend, haven’t reached levels of concern. Thus, for the time being, the path of least resistance for equities is probably higher.