

Asset Allocation Weekly (December 1, 2017)
by Asset Allocation Committee
Given the length of the current expansion, there is growing concern about the economy’s ability to avoid recession. So far, none of our indicators suggests the economy is near a downturn. Of all the indicators we monitor, the yield curve is the most reliable; however, there are potentially dozens of iterations of “the yield curve.” The two-year/10-year T-note spread is used in the leading economic indicators.
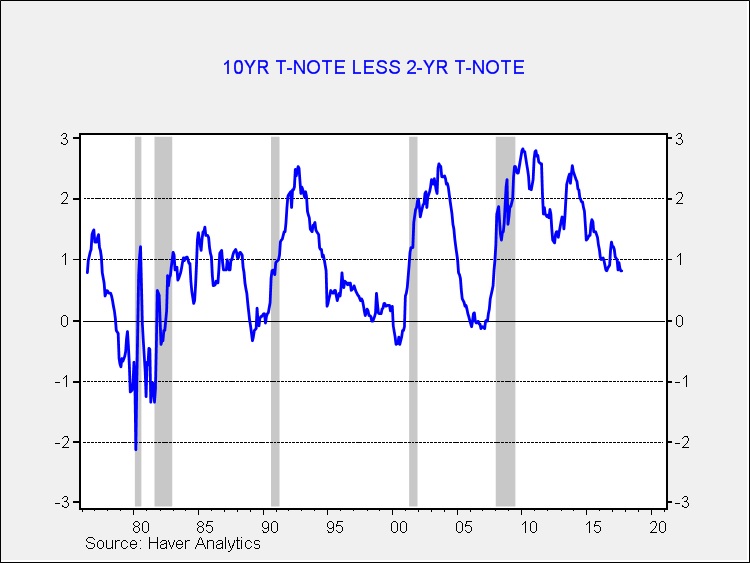
The indicator is quite reliable with no real false positives. This is monthly data through October; currently, the spread is around 65 bps, meaning it is approaching inversion but still above zero, meaning the economy is probably still on pace to avoid recession over the next year.
Other calculations of the yield curve offer other insights. The spread between the implied three-month LIBOR rate from the Eurodollar futures market, two-year deferred, relative to fed funds offers insights into monetary policy. The Eurodollar futures market is where unhedged interest rate swaps are offset, so a rising implied rate on the deferred contracts suggests increased hedging activity and fears of rising rates. When those implied rates stop rising, it can offer a signal to policymakers that they have moved rates enough.
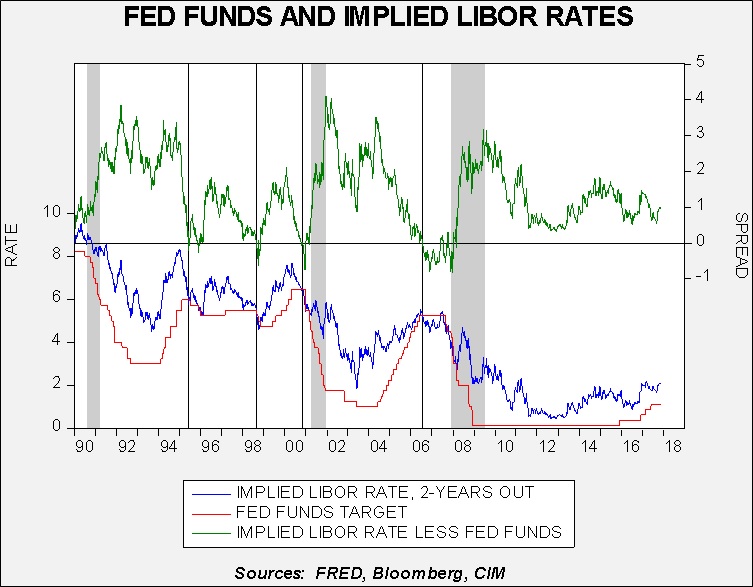
The lower two lines on the chart show the implied three-month LIBOR rate and the fed funds target. The upper line is the spread between the two rates. The important insight from this analysis is that the FOMC stops raising rates when the spread inverts. Chair Greenspan was able to prevent two recessions, one in 1994 and another in 1998, by rapidly cutting rates when the implied rate fell below the fed funds target. Although the FOMC did move rapidly in 2000, the rate cuts were not aggressive enough to prevent a recession. At the same time, the 2001 recession was rather mild. In the 2004-06 tightening cycle, the FOMC did stop raising rates once the spread inverted; however, the central bank kept rates elevated despite the inversion. As financial conditions deteriorated, the Federal Reserve moved to cut rates aggressively but this action was not enough to prevent the Global Financial Crisis.
So, what does this chart tell us now? As long as the spread isn’t inverted, the FOMC will probably continue to raise rates. Note the reaction of implied LIBOR rates in 2016 after the December 2015 rate hike. As the implied LIBOR rate fell, the FOMC, which had been signaling higher rates for 2016, held rates steady until December and only raised rates as the implied LIBOR rate rose as well. Overall, this pattern suggests that the current spread will support a December rate hike. However, next year’s rate moves should follow the implied LIBOR rate. If that rate fails to rise with policy tightening, we would expect the FOMC to slow the pace of increases next year.