

Asset Allocation Weekly (August 5, 2016)
by Asset Allocation Committee
Last week’s GDP data for Q2 came in below expectations, rising 1.2%. Consumption was robust, accounting for 2.8% of GDP growth, but investment reduced growth by 1.7% and government peeled 0.2% from output. Net exports added 0.2% to GDP, but we would not be surprised to see the sector revised downward due to the strength of consumption. The drop in investment was mostly due to falling inventories, accounting for 1.2% of the 1.7% investment report. Still, investment remains very disappointing.
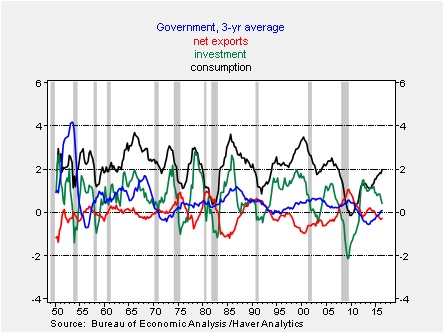
This chart shows the three-year average of the contribution to GDP from the four major components of the report. Government and net exports have been mostly a wash. Consumption is finally improving, although it still remains well below levels seen in previous expansions. However, the drop in investment is becoming alarming. As we have shown in the past, businesses are reducing their savings but are spending the funds on mergers, dividends and share buybacks. New investment has been rare.
Perhaps the most disturbing part of the report is the growing evidence that the economy “has fallen and can’t get up.”
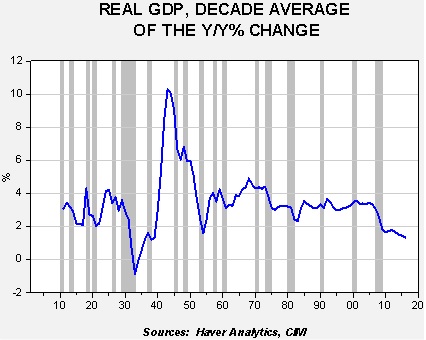
This chart shows the yearly change in annual real GDP averaged over a decade. The original data begins in 1901. About 72% of the time, the trend in GDP growth ranges between 2.0% and 4.5%. The current period of eight consecutive years of sub-2.0% growth is matched in duration only by the Great Depression. Although the drop in growth in the 1930s was clearly deeper, the rebound was much stronger as well. Currently, GDP is weak and showing no signs of improvement.
This chart, though simple, makes a strong case that the economy is in a state of secular stagnation. Thankfully, the economy isn’t suffering from the terrible policy mistakes of the 1930s. The Federal government’s fiscal stance isn’t nearly as tight and the FOMC has been much more accommodative than in the Depression years.
First, monetary policy has been more accommodative and reacted quicker to the downturn.
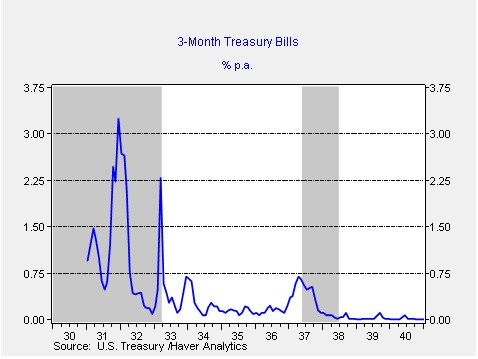
This chart shows three-month T-bill rates during the Depression. Note that interest rates rose sharply in 1931 and 1933. Even in 1936-37, the Fed allowed for a modest increase in rates that were part of an “echo” recession from the Great Depression.
Second, the path of fiscal policy was significantly different during the 1930s.
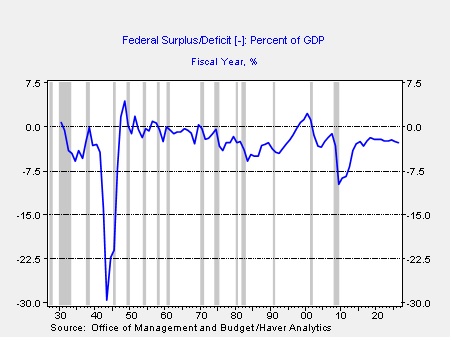
The Obama administration’s fiscal package in 2008-10 was larger than the Hoover-Roosevelt budget deficits. It is widely held that Roosevelt’s decision to balance the fiscal budget after winning reelection in 1936 triggered the 1937-38 recession. So far, we haven’t seen such dramatic fiscal retrenchment, and, given the tone of the current election campaign, we would not expect austerity in the future.
However, a key difference to the recovery after the Great Depression was the massive fiscal spending related to the war effort. It is unknown whether the economy would have been able to return to the 2.0% to 4.0% growth range without the war spending. It may be the case that a major boost in fiscal spending could be the cure for current slow growth. However, it should also be acknowledged that (a) it is highly unlikely that a peacetime fiscal spending package could be as large as what was seen in the 1940s, and (b) the war, by design, deglobalized world trade. A massive fiscal expansion in a globalized world would see much of the potential growth siphoned off to imports. Only if all the G-20 nations agreed to similar packages could that problem be avoided, and that degree of cooperation is unlikely.
Thus, we expect growth to remain slow and policy accommodation to remain in place. It makes little sense to normalize monetary or fiscal policy in such a slow growth regime.