

Asset Allocation Weekly (August 19, 2016)
by Asset Allocation Committee
U.S. equity markets are showing impressive strength.
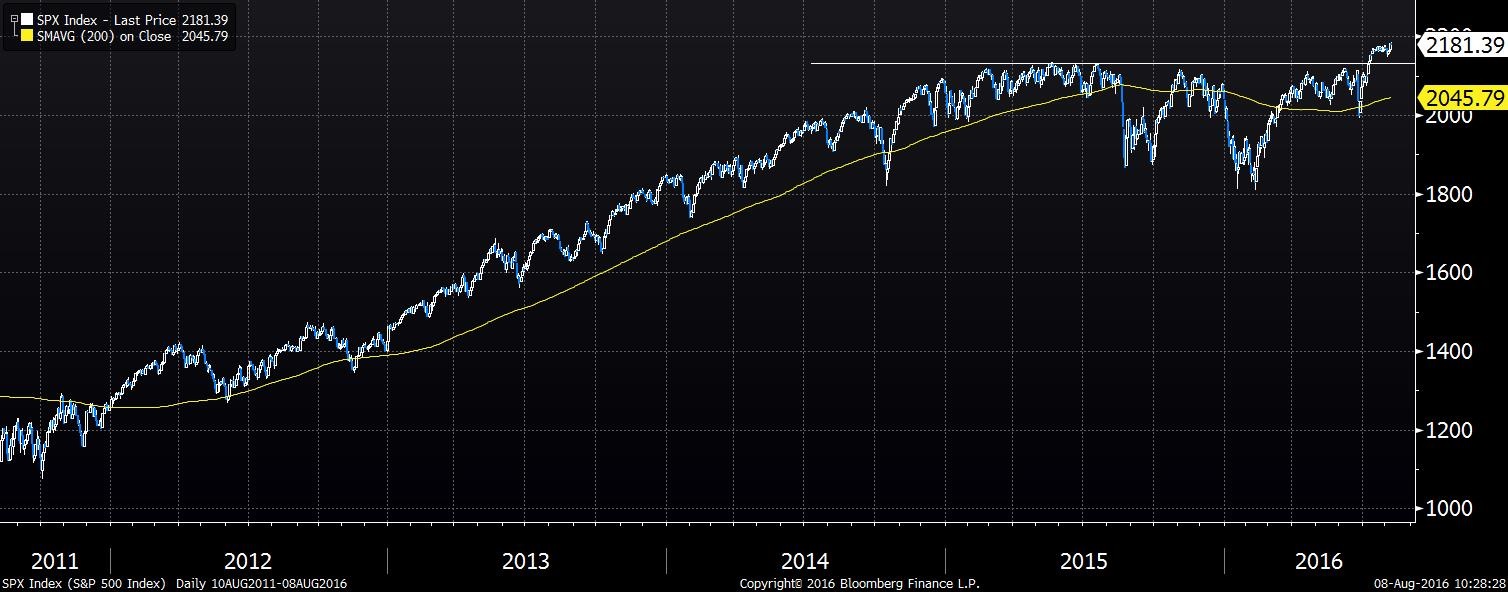
This chart shows the S&P 500 Index along with the 200-day moving average. The white horizontal line shows recent highs; note that the S&P 500 has recently moved above these highs. Technically, this is a “breakout” and suggests the market will likely move higher.
Still, this rally has occurred with slowing earnings growth. Although S&P 500 operating earnings are coming in better than expected, they are still down about 2% from last year.[1] Rising equity prices with falling earnings implies a rising P/E (confirmed below). Without an increase in future earnings, equity markets are becoming increasingly pricey.
One of our more reliable indicators during this cyclical bull market has been the relationship between the S&P 500 and the Federal Reserve’s balance sheet.
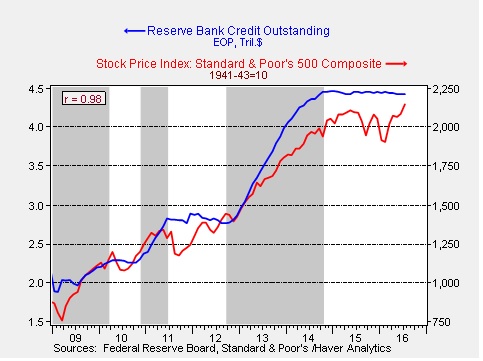
This chart shows the size of the Fed’s balance sheet along with the S&P 500 Index. Periods of quantitative easing (QE) are shown in gray. Note that since the recovery began in 2009, equity values tended to rise during and in anticipation of a balance sheet expansion and move sideways during periods where the balance sheet remained steady.
This chart shows a regression of the relationship.
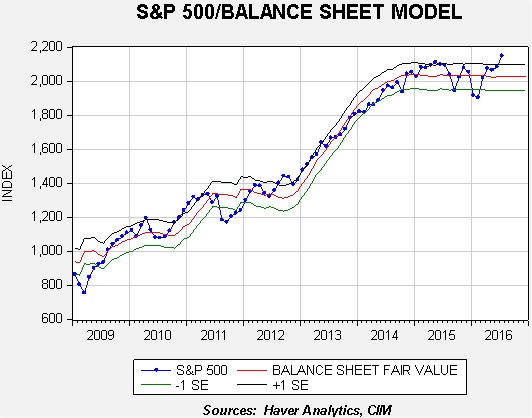
This chart shows the fair value for the S&P 500, based on the Fed’s balance sheet, along with standard error bands. Over the past seven years, the upper standard error band has been a signal that markets are overvalued; dips to the lower standard error bank suggest a more favorably valued equity market.
We are currently well above one standard error which raises three possibilities. The first is that equities are overvalued and primed for a pullback (fair value is 2,025 and the lower standard error line is 1,947). The second is that the relationship was always spurious and the recent rise is uncorrelated. The third is that there are other variables that are now more important which can justify the recent rise. We disagree with the second possibility because the relationship between the Fed’s balance sheet and the Shiller P/E is also quite strong, suggesting that unconventional monetary policy boosted investor sentiment and supported a higher P/E.
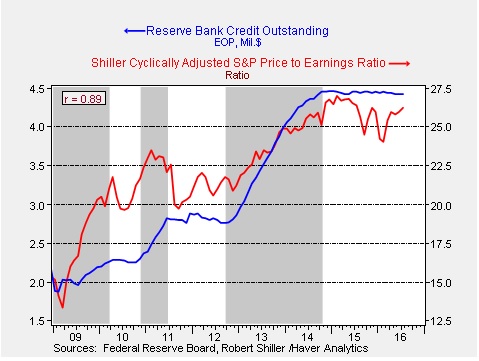
This chart shows the relationship of P/E ratios and the balance sheet; note that the P/E rises sharply during periods of QE. We believe this relationship offers support for the notion that unconventional monetary policy lifted investor sentiment and P/E ratios remained steady in its absence.
However, the third possibility does remain—there are new factors that are boosting equities. We note the equity markets rallied on Friday’s strong employment data. However, the historical record on the relationship of employment and equities is mixed. Clearly, an improving labor market signals that a recession isn’t imminent. But, when the labor market becomes very strong, it often triggers tighter monetary policy. At present, the financial markets do not expect tighter policy until December at the earliest. Thus, at least in the short run, the equity markets may be in a “sweet spot” where better growth may lift top line revenues without triggering tighter policy. However, these favorable conditions may not last. Therefore, our base case is that equities are fully valued but a correction may not be imminent.
At the same time, equities are not cheap and could be vulnerable to exogenous issues, such as the U.S. presidential elections and terrorism. As a result, we would not be surprised to see a modest correction in the coming months but, as long as a recession is avoided (which we expect), a major pullback isn’t likely.
_______________________
[1] Using Thompson-Reuters’ calculation of operating earnings.